Implementing KPIs from Analysis Services
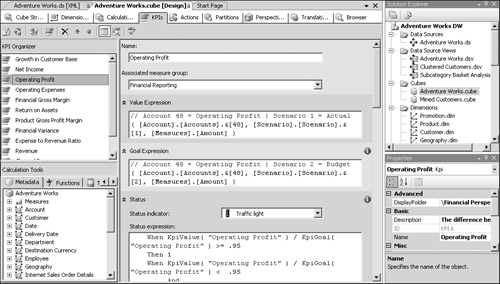
KPIs can also be created from data in SQL Server 2005 Analysis Services. In this scenario, Analysis Services has done all the work to analyze the data and create the KPI within its own framework, and SharePoint creates an indicator from the data as it is presented. The values of the goal, the warning, and the indicator itself are all defined in Analysis Services, as shown in Figure 16.15, so there are not many options that you need to configure at the SharePoint level other than selecting which indicators to display on your KPI list. Indicators created from Analysis Services are the only ones that can show trends because this information is processed by Analysis Services.
Creating an Office data connection to your Analysis Services cube
The first step in creating an indicator from SQL Server Analysis Services is to configure the connection to the cube for the KPI to use. You do this by using Excel 2007 to create the Office Data Connection (ODC) file and then uploading that to a data connection library. By storing your ODC files in a data connection library, you enable user access to those data sources without having to know all the details about server, database, and security settings. You can, however, use Windows security for the connection so that ...
Get Microsoft® SharePoint® Server 2007 Bible now with the O’Reilly learning platform.
O’Reilly members experience books, live events, courses curated by job role, and more from O’Reilly and nearly 200 top publishers.

