Chapter 7. Working with Diagrams and Charts
Chapter at a Glance
|
In this chapter, you will learn to: | |
|
✓ |
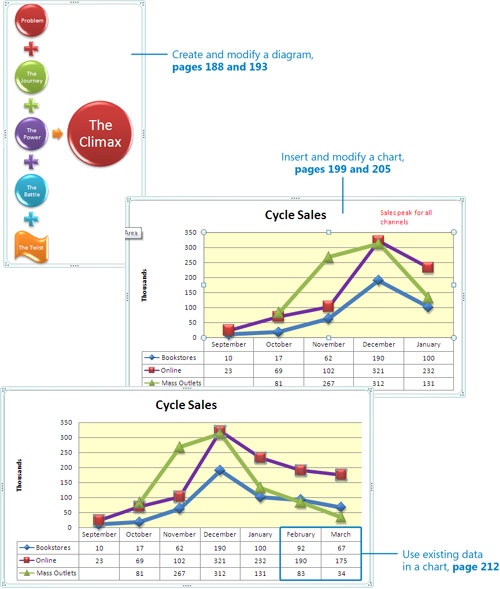
Create a diagram. |
|
✓ |
Modify a diagram. |
|
✓ |
Insert a chart. |
|
✓ |
Modify a chart. |
|
✓ |
Use existing data in a chart. |
You will often find it helpful to reinforce the argument you are making in a document with facts and figures that are best presented in a diagram or chart. These graphic objects serve the following purposes:
In this ...
Get Microsoft® Office Word 2007 Step by Step now with the O’Reilly learning platform.
O’Reilly members experience books, live events, courses curated by job role, and more from O’Reilly and nearly 200 top publishers.

