Chapter 7. Working with Charts
Chapter 7 at a Glance
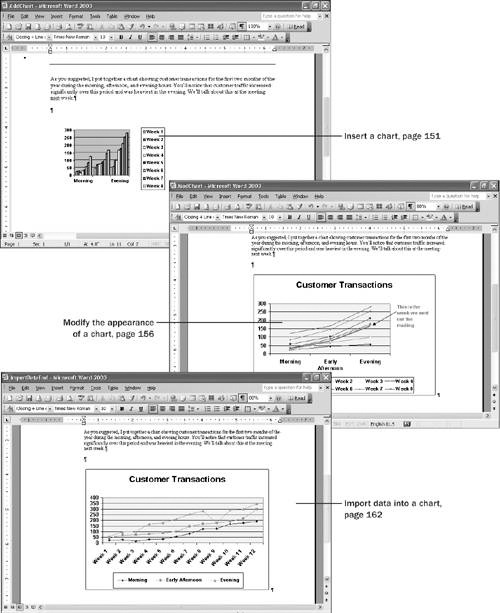
In this chapter you will learn to: | |
✓ | Insert a chart. |
✓ | Modify the appearance of a chart. |
✓ | Import data into a chart. |
When you want to compare numeric information, you can create a chart. Charts are graphics that use lines, bars, columns, "pie" slices, or other markers to represent numbers and other values. Adding a chart to a document creates visual interest and can effectively show trends, illustrate relationships, or demonstrate how information changes over time. For example, The Garden Company might want to use a chart to visually compare quarterly sales by department or the number of people who attended ...
Get Microsoft® Office Word 2003 Step by Step now with the O’Reilly learning platform.
O’Reilly members experience books, live events, courses curated by job role, and more from O’Reilly and nearly 200 top publishers.

