Chapter 2. Working with Tables
✓ | Understanding tables and indicators |
✓ | Modifying tables |
✓ | Customizing tables |
✓ | Working with the Details portion of usage views |
Tables are part of most views in Project, providing project information in a columnar format. But you aren’t limited to the table that appears when you display a view; you can switch to a different table to see different information. You also can control the fields that Project displays in a table and even create your own tables.
Understanding Tables
If you use a spreadsheet program like Excel, tables should remind you of a spreadsheet. Project presents information in a row/column format, and you make changes to project information by using the fields on the table. Each table in Project helps you focus on and change different kinds of information. The default table that appears in Gantt Chart view, for example, is the Entry table (see Figure 2-1). Using the Entry table, you can set up basic information (such as the task name and estimated duration) as you add tasks to your project.
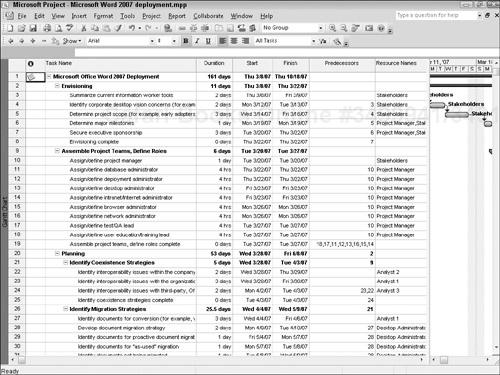
Figure 2-1. The Entry table helps you focus on setting up tasks or resources.
Take a look at some of the commonly used task tables. The Cost table, shown in Figure 2-2, helps you focus on the estimated, baseline, actual, and remaining costs associated with your project.
Figure 2-2. The Cost table helps you determine ...
Get Microsoft® Office Project 2007 All-in-One Desk Reference For Dummies® now with the O’Reilly learning platform.
O’Reilly members experience books, live events, courses curated by job role, and more from O’Reilly and nearly 200 top publishers.

