Chapter 9. Adding Tables, Charts, and Diagrams
Chapter 9 at a Glance
In this chapter you will learn to:
|
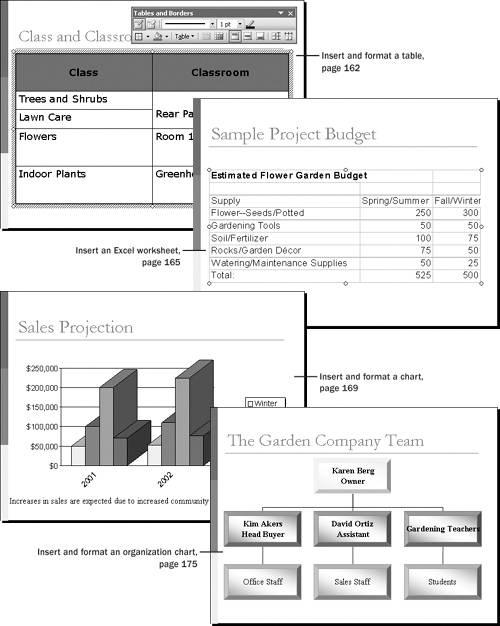
Often you will want to bolster the argument you are making in a Microsoft Office PowerPoint 2003 presentation with facts and figures that are best presented in a table, chart, or diagram. These objects are all easily placed on PowerPoint slides that have been assigned a layout that includes a content placeholder. You use them as follows:
You use tables to condense information into highly structured row and column ...
Get Microsoft® Office PowerPoint® 2003 Step by Step now with the O’Reilly learning platform.
O’Reilly members experience books, live events, courses curated by job role, and more from O’Reilly and nearly 200 top publishers.

