Switching Rows and Columns
It would be great if Excel always knew exactly what you wanted and gave you a perfect chart on the first try. Unfortunately, although the program is intelligent, it is not clairvoyant. One of the things it might get wrong on occasion has to do with the assignment of series and data points. For example, suppose you want to plot the following table as a simple two-dimensional column chart:
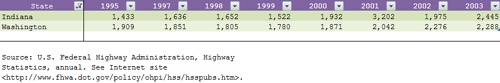
If you follow the steps described a few paragraphs ago, Excel gives you this:
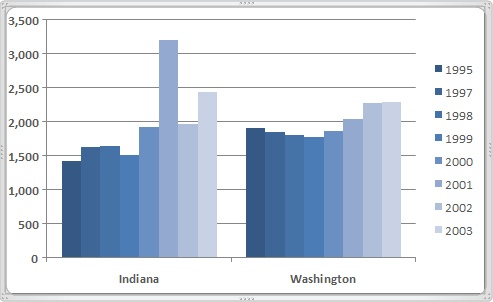
That is, it plots each yearly column in the source range as ...
Get Microsoft® Office Excel® 2007 Inside Out now with the O’Reilly learning platform.
O’Reilly members experience books, live events, courses curated by job role, and more from O’Reilly and nearly 200 top publishers.

