Charts
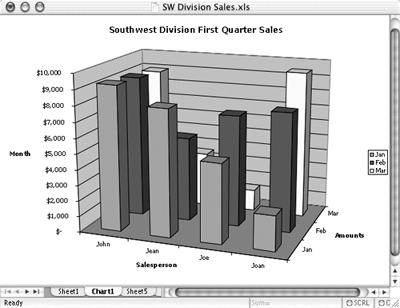
A chart is a graphic representation of data. A chart can be embedded in a worksheet (Figure 1) or can be a chart sheet of its own (Figure 2).
Figure 1. Here's a 3-D pie chart embedded in a worksheet file.

Figure 2. Here's a 3-D column chart on a chart sheet of its own.

With Microsoft Excel, you can create many different types of charts. The 3-D pie chart and 3-D column chart shown here (Figures 1 and 2) are only two examples. Since each type of chart has at least one variation and you can customize any chart you create, there's no limit to ...
Get Microsoft Excel X for Mac OS X: Visual QuickStart Guide now with the O’Reilly learning platform.
O’Reilly members experience books, live events, courses curated by job role, and more from O’Reilly and nearly 200 top publishers.

