Creating Sparklines
To create a sparkline, select the cell where you want the sparkline to appear, and then click the Insert tab. The Sparklines group appears, more or less in the center of the Insert tab:
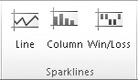
Choose a chart type from the three offerings here, and then fill out the ensuing dialog box:
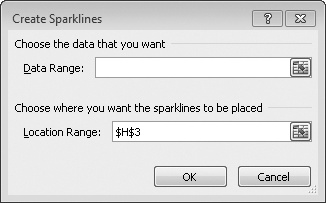
In the Data Range field, point to the cell or cells whose data you want to plot; in the Location Range field, enter the location of the new sparkline.
The three chart types included in the Sparklines group—Line, Column, and Win/Loss—are the only choices available ...
Get Microsoft® Excel® 2010 Inside Out now with the O’Reilly learning platform.
O’Reilly members experience books, live events, courses curated by job role, and more from O’Reilly and nearly 200 top publishers.

