Adding and Positioning Data Labels
Some of the built-in layout options include data labels—text identifying the value of each point in a data series—but the size of the ribbon icons doesn’t make it easy to discern which do and which don’t. You can add data labels to all series in a chart by selecting the chart, clicking the Layout tab, and then clicking Data Labels in the Labels group. A gallery of positioning options appears. (The available options depend on the chart type.) With some charts you might find a Best Fit option; as Figure 19-2 shows, this option can be handy on pie charts with narrow slices.
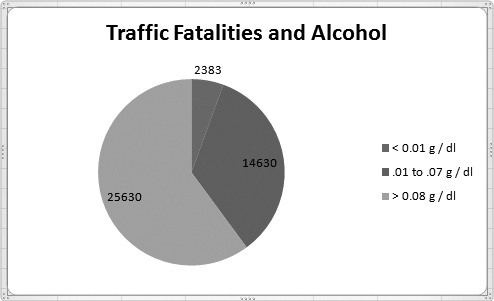
Figure 19-2. Because we chose Best Fit for ...
Get Microsoft® Excel® 2010 Inside Out now with the O’Reilly learning platform.
O’Reilly members experience books, live events, courses curated by job role, and more from O’Reilly and nearly 200 top publishers.

