Choosing a Chart Type
The entry to the charting user interface is via the Insert tab on the ribbon. When you have selected the data you want to chart (or a single cell within that block of data), click the Insert tab. The Charts group on the ribbon appears in the center of the ribbon, presenting you with a selection of available chart types:
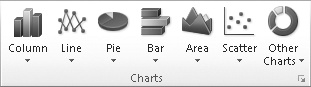
Each of the basic chart types shown in the Charts group includes a large number of subtype options. Clicking a chart-type button reveals the gallery of its subtypes. When you click the Column button, for example, you see the following gallery.
At the bottom of each subtype gallery is an item called All Chart Types. ...
Get Microsoft® Excel® 2010 Inside Out now with the O’Reilly learning platform.
O’Reilly members experience books, live events, courses curated by job role, and more from O’Reilly and nearly 200 top publishers.

