Plug-In Debugging
You can debug your plug-in in three ways. The first, as shown in Table 23.1, is by attaching the debugger to the host process, the second is by forcing the plug-in to call the debugger, and the third is by using plug-in profiler. For any of these methods, it is recommended to try them in a testing environment because these methods use Visual Studio and will interrupt all user activity with the server if you attempt to enable debugging in a production environment.
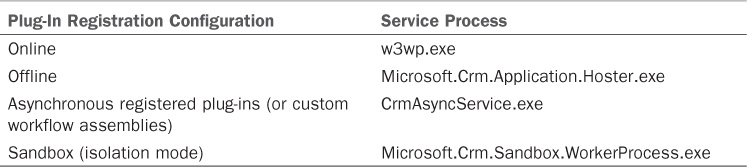
TABLE 23.1 Attaching Debugger to Host Process
Before trying first or second method, you need to build your plug-in with debug mode and put the PDB (project database) ...
Get Microsoft Dynamics CRM 2013 Unleashed now with the O’Reilly learning platform.
O’Reilly members experience books, live events, courses curated by job role, and more from O’Reilly and nearly 200 top publishers.

