Appendix C Example Data and Calculations
Appendix C contains data and charts used by several of the examples in Chapter 5:
Appendix C.1 illustrates the calculations used to determine the standard deviation for release 1 of the example illustrating the use of X-bar and S charts in Chapter 5.
Appendix C.2 contains data and calculations for constructing the individuals and median range charts example in Chapter 5.
Appendix C.1
Calculations for determining the standard deviation (S) for release 1 data are given here using the formula
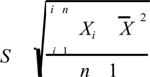
The table in Figure C.1 lists the values (X i) of SLOC/review hour for each inspection in release 1, the average ...
Get Measuring the Software Process: Statistical Process Control for Software Process Improvement now with the O’Reilly learning platform.
O’Reilly members experience books, live events, courses curated by job role, and more from O’Reilly and nearly 200 top publishers.

