Skill 37 Interpret Charts and Graphs
Graphs and charts are visual representations of numbers and their relationships to each other. You are likely to be asked to interpret one on the ASVAB test.
Circle Graph. Look at the following graph, which represents the ice cream flavor preferences reported in a poll of 165 students at a certain high school. This kind of graph is called a circle graph or pie graph (because it resembles a pie with slices). Based on the graph, which flavor was the favorite of the largest group of students who were polled?
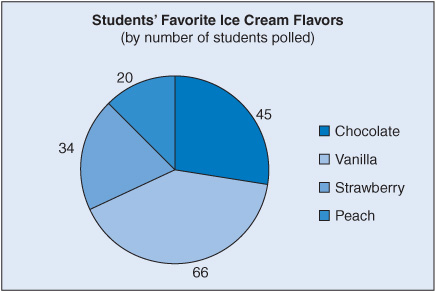
The graph makes it easy to see that the largest group, 66 students, preferred vanilla.
Sometimes the ...
Get McGraw-Hill's Top 50 Skills For A Top Score: ASVAB Reading and Math now with the O’Reilly learning platform.
O’Reilly members experience books, live events, courses curated by job role, and more from O’Reilly and nearly 200 top publishers.

