Adding a legend
A proper figure is not complete without its own legend. matplotlib provides a way to generate a legend with the minimal amount of effort. In this recipe, we will see how to add a legend to a graph.
How to do it...
For this recipe, we use the pyplot.legend() function as well as the label optional parameter:
import numpy as np
import matplotlib.pyplot as plt
X = np.linspace(0, 6, 1024)
Y1 = np.sin(X)
Y2 = np.cos(X)
plt.xlabel('X')
plt.ylabel('Y')
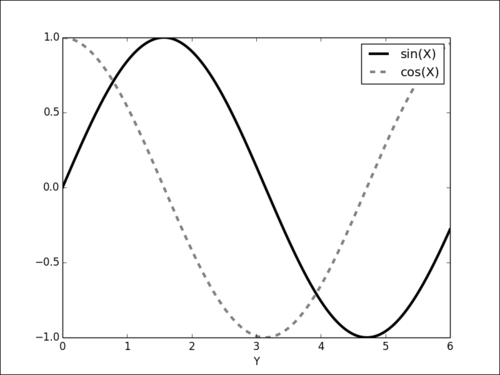
plt.plot(X, Y1, c = 'k', lw = 3., label = 'sin(X)')
plt.plot(X, Y2, c = '.5', lw = 3., ls = '--', label = 'cos(X)')
plt.legend()
plt.show()The preceding code gives the following output:
How it ...
Get matplotlib Plotting Cookbook now with the O’Reilly learning platform.
O’Reilly members experience books, live events, courses curated by job role, and more from O’Reilly and nearly 200 top publishers.

