Adding text
So far, we have seen how to set text at preset locations, such as title and axes. In this recipe, we are going to see how to add text at any location using text boxes.
How to do it...
matplotlib has a very flexible function called pyplot.text(), that displays text:
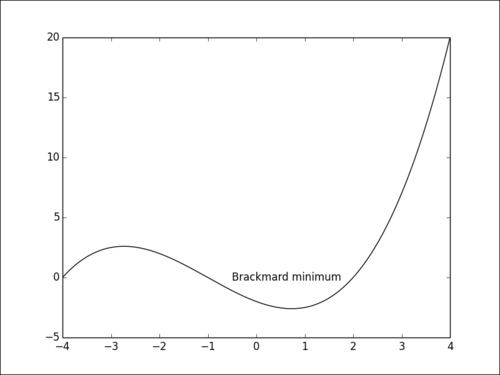
import numpy as np
import matplotlib.pyplot as plt
X = np.linspace(-4, 4, 1024)
Y = .25 * (X + 4.) * (X + 1.) * (X - 2.)

plt.text(-0.5, -0.25, 'Brackmard minimum')

plt.plot(X, Y, c = 'k')
plt.show()
This script displays text next to a curve:
How it works...
We use the pyplot.text() function that takes a position and the text to display. The position is given in the graphic coordinates, ...
Get matplotlib Plotting Cookbook now with the O’Reilly learning platform.
O’Reilly members experience books, live events, courses curated by job role, and more from O’Reilly and nearly 200 top publishers.

