Adding a title
Let's start with something simple: adding a title to a graphic.
How to do it...
The following code will add a title to the figure:
import numpy as np
import matplotlib.pyplot as plt
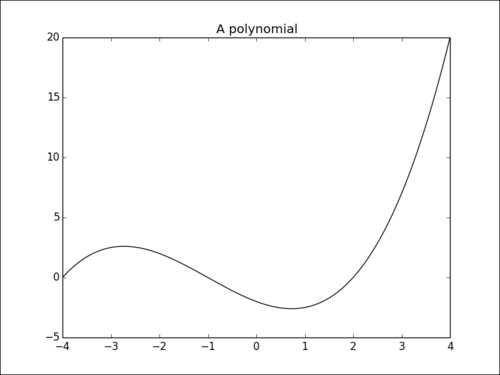
X = np.linspace(-4, 4, 1024)
Y = .25 * (X + 4.) * (X + 1.) * (X - 2.)
plt.title('A polynomial')
plt.plot(X, Y, c = 'k')
plt.show()Here, we render a simple curve and add a title to the figure, which appears at the top of the figure:
How it works...
It's simply done with the pyplot.title()function, which takes one string as a parameter and sets the title for the whole figure.
Get matplotlib Plotting Cookbook now with the O’Reilly learning platform.
O’Reilly members experience books, live events, courses curated by job role, and more from O’Reilly and nearly 200 top publishers.

