Plotting stacked bar charts
Stacked bar charts are of course possible by using a special parameter from the pyplot.bar() function.
How to do it...
The following script stacks two bar charts on each other:
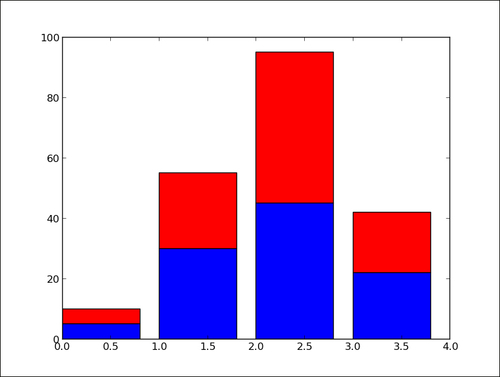
import matplotlib.pyplot as plt

A = [5., 30., 45., 22.]
B = [5., 25., 50., 20.]

X = range(4)

plt.bar(X, A, color = 'b')
plt.bar(X, B, color = 'r', bottom = A)
plt.show()
The preceding script will produce the following graph:
How it works...
The optional bottom parameter of the pyplot.bar() function allows you to specify a starting value for a bar. Instead of running from zero to a value, it will go from the bottom to value. The first call to pyplot.bar() ...
Get matplotlib Plotting Cookbook now with the O’Reilly learning platform.
O’Reilly members experience books, live events, courses curated by job role, and more from O’Reilly and nearly 200 top publishers.

