Plotting bar charts
Bar charts are a common staple of plotting package, and even matplotlib has them.
How to do it...
The dedicated function for bar charts is pyplot.bar(). We will enable this function by executing the following script:
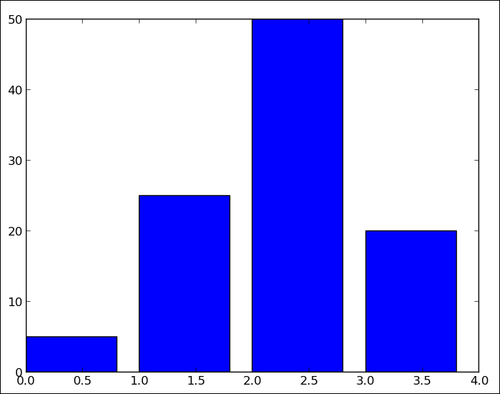
import matplotlib.pyplot as plt

data = [5., 25., 50., 20.]

plt.bar(range(len(data)), data)
plt.show()
The preceding script will produce the following graph:
How it works...
For each value in the list data, one vertical bar is shown. The pyplot.bar() function receives two arguments—the x coordinate for each bar and the height of each bar. Here, we use the coordinates 0, 1, 2, and so on, for each bar, which is the purpose ...
Get matplotlib Plotting Cookbook now with the O’Reilly learning platform.
O’Reilly members experience books, live events, courses curated by job role, and more from O’Reilly and nearly 200 top publishers.

