Plotting points
When displaying a curve, we implicitly assume that one point follows another—our data is the time series. Of course, this does not always have to be the case. One point of the data can be independent from the other. A simple way to represent such kind of data is to simply show the points without linking them.
How to do it...
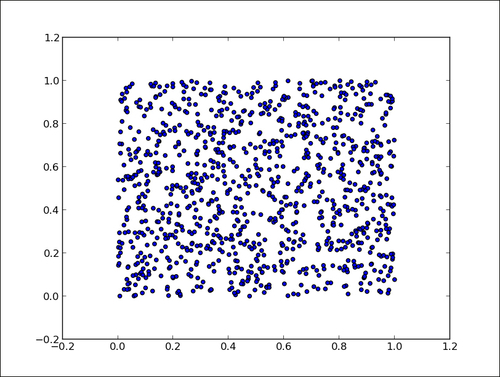
The following script displays 1024 points whose coordinates are drawn randomly from the [0,1] interval:
import numpy as np
import matplotlib.pyplot as plt

data = np.random.rand(1024, 2)

plt.scatter(data[:,0], data[:,1])
plt.show()
The preceding script will produce the following graph:
How it works...
The function ...
Get matplotlib Plotting Cookbook now with the O’Reilly learning platform.
O’Reilly members experience books, live events, courses curated by job role, and more from O’Reilly and nearly 200 top publishers.

