15.12. Filter Visualization Tool
The response characteristics can be viewed in a separate window by selecting the ‘Filter Visualization Tool’ (FV Tool) from ‘view’ menu or clicking the ‘Full View Analysis’ ![]() button on the toolbar. The FV Tool window is shown in Figure 15.31.
button on the toolbar. The FV Tool window is shown in Figure 15.31.
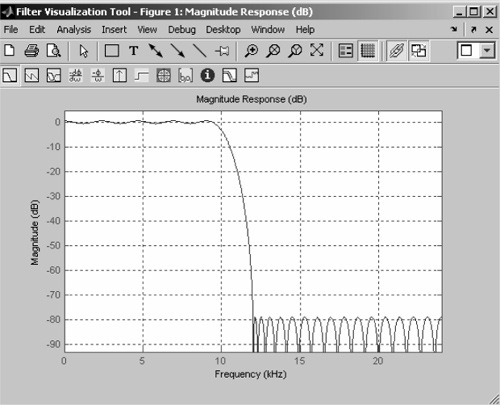
FV Tool has most of the menus on the menu bar and icons on the toolbar similar to that FDA Tool with some additional icons which are mainly used to work with representation of the responses.
Get MATLAB® and Its Applications in Engineering: [Based on MATLAB 7.5 (R2007b)] now with the O’Reilly learning platform.
O’Reilly members experience books, live events, courses curated by job role, and more from O’Reilly and nearly 200 top publishers.

