12.7. Root Locus Plot (State-Space Representation)
When a control system is represented in state-space form, the command used to plot the root locus for the system is
rlocus(A, B, C, D)
The gain vector K is calculated adaptively to produce a smooth plot curve. There are two more types of this rlocus command.
| rlocus(A,B,C,D,K) | Uses a user-specified vector K of gains. |
| [r,K]=rlocus(A,B,C,D,K) | Returns the matrix r of complex root locations for the gains K. |
Example 12.11.
|
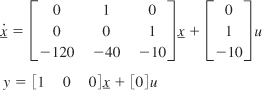
Consider the system whose behaviour is described by the following state-space equations:
Obtain the root locus plot using MATLAB. Solution: %Program to Plot the root locus for system ... |
Get MATLAB® and Its Applications in Engineering: [Based on MATLAB 7.5 (R2007b)] now with the O’Reilly learning platform.
O’Reilly members experience books, live events, courses curated by job role, and more from O’Reilly and nearly 200 top publishers.

