A2.5. Displaying Response Characteristics on a Plot
The characteristics for different types of plots, like rise time, peak overshoot, settling time, steady state etc. for step responses and gain margin and phase margin for bode diagrams can be obtained and displayed.
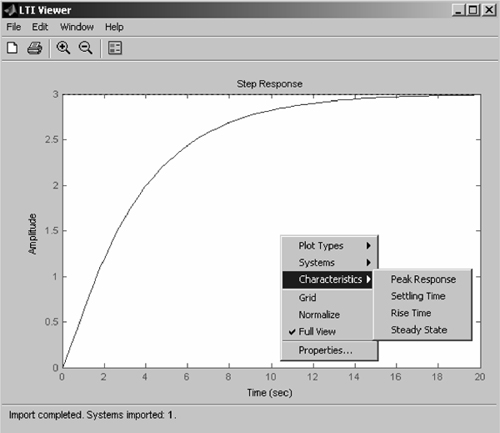
The procedure for obtaining rise time for a step response is as follows:
1. | Right click the mouse in the LTI Viewer window. |
2. | From the ‘Characteristics’ option, select ‘Rise Time’ as shown in the Figure A2.6, a dotted line showing the rise time will appear.
|
3. | To display the value, click on the ... |
Get MATLAB® and Its Applications in Engineering: [Based on MATLAB 7.5 (R2007b)] now with the O’Reilly learning platform.
O’Reilly members experience books, live events, courses curated by job role, and more from O’Reilly and nearly 200 top publishers.

