In this section, we'll take a look at using graphs to help visualize packets and trends, especially in TCP communications. Here we have a packet capture of a file transfer that has gone horribly wrong:
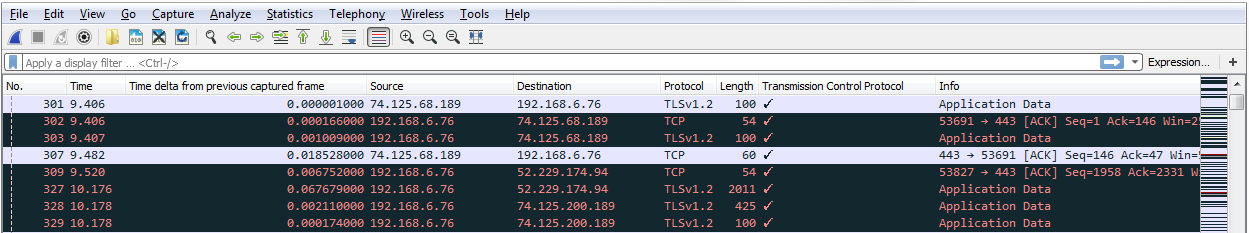
As you can see, we have all sorts of black bars coming up, which is a big telltale sign in Wireshark that there's something amiss. You can also see there's a striping pattern that comes about. That's a big telltale sign that there are a bunch of retransmissions. So, what we'll do is use this as our basis for graphing and being able to pick out some issues.

