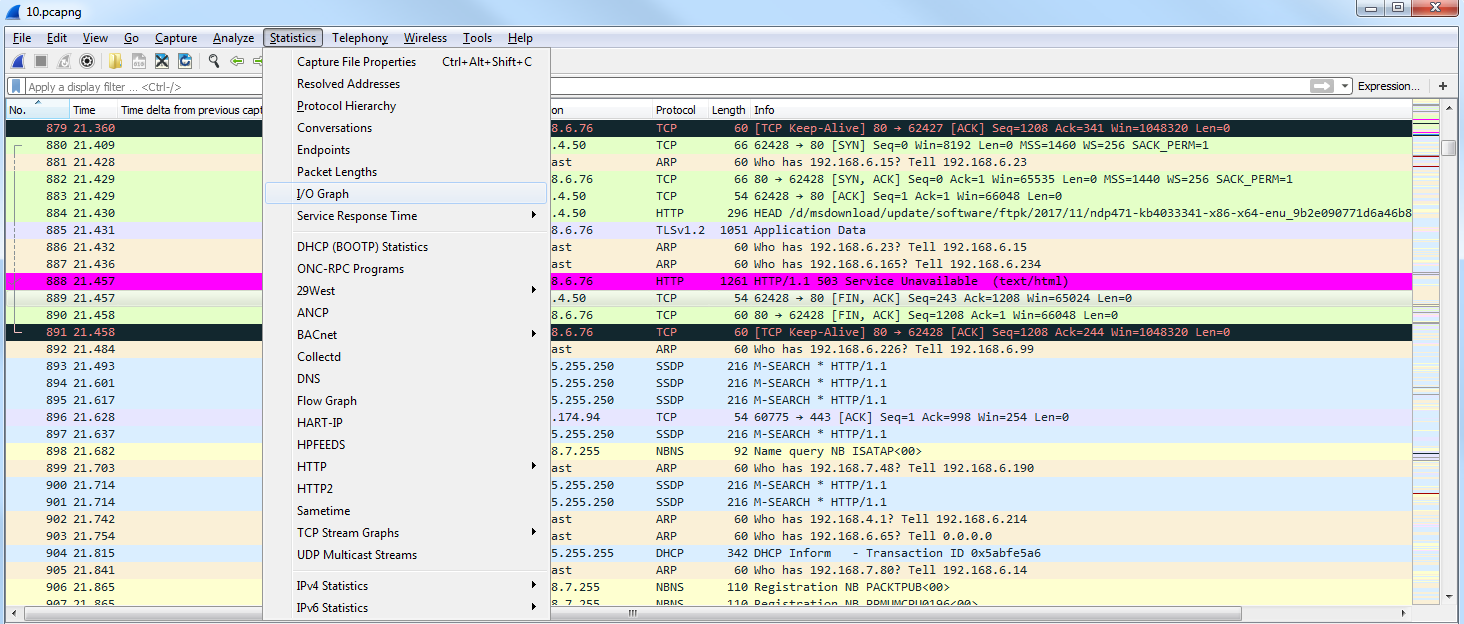
Let's look at the I/O graph now. Click on Statistics and go to I/O Graph:
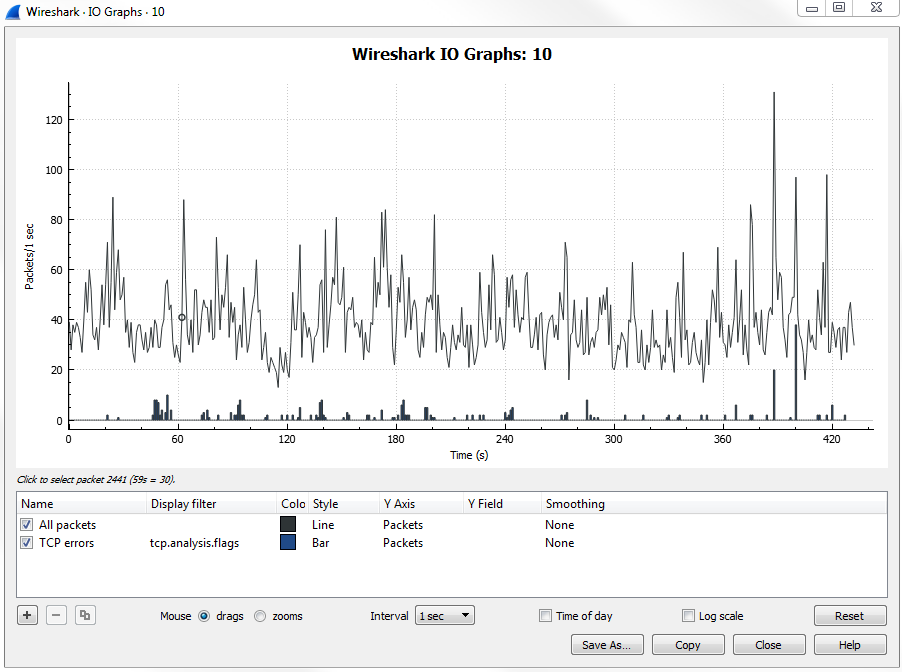
I/O graphs is a great graphical representation of the amount of data that's flowing through the packet capture, from the beginning to the end. I clicked on Start on the capture. Then, I went to my browser and opened it and typed in http://www.pbs.org/, and then pressed Enter. Then we saw the spike of traffic as it went and got that data from the content servers for PBS. And then that communication ended and I stopped the capture:
If you have a consistent file ...

