The script debugger has been introduced in the Istanbul release for use in server-side scripting. This allows developers to set break points in any server-side script, to then step through in the debugger.
To use the debugger, you must first click the left margin in a script to create a break point. Then, to load the script debugger, navigate to System Diagnostics | Script Debugger. The script debugger appears in a new window, where you can see the break points created in the script, as in Figure 5.5:
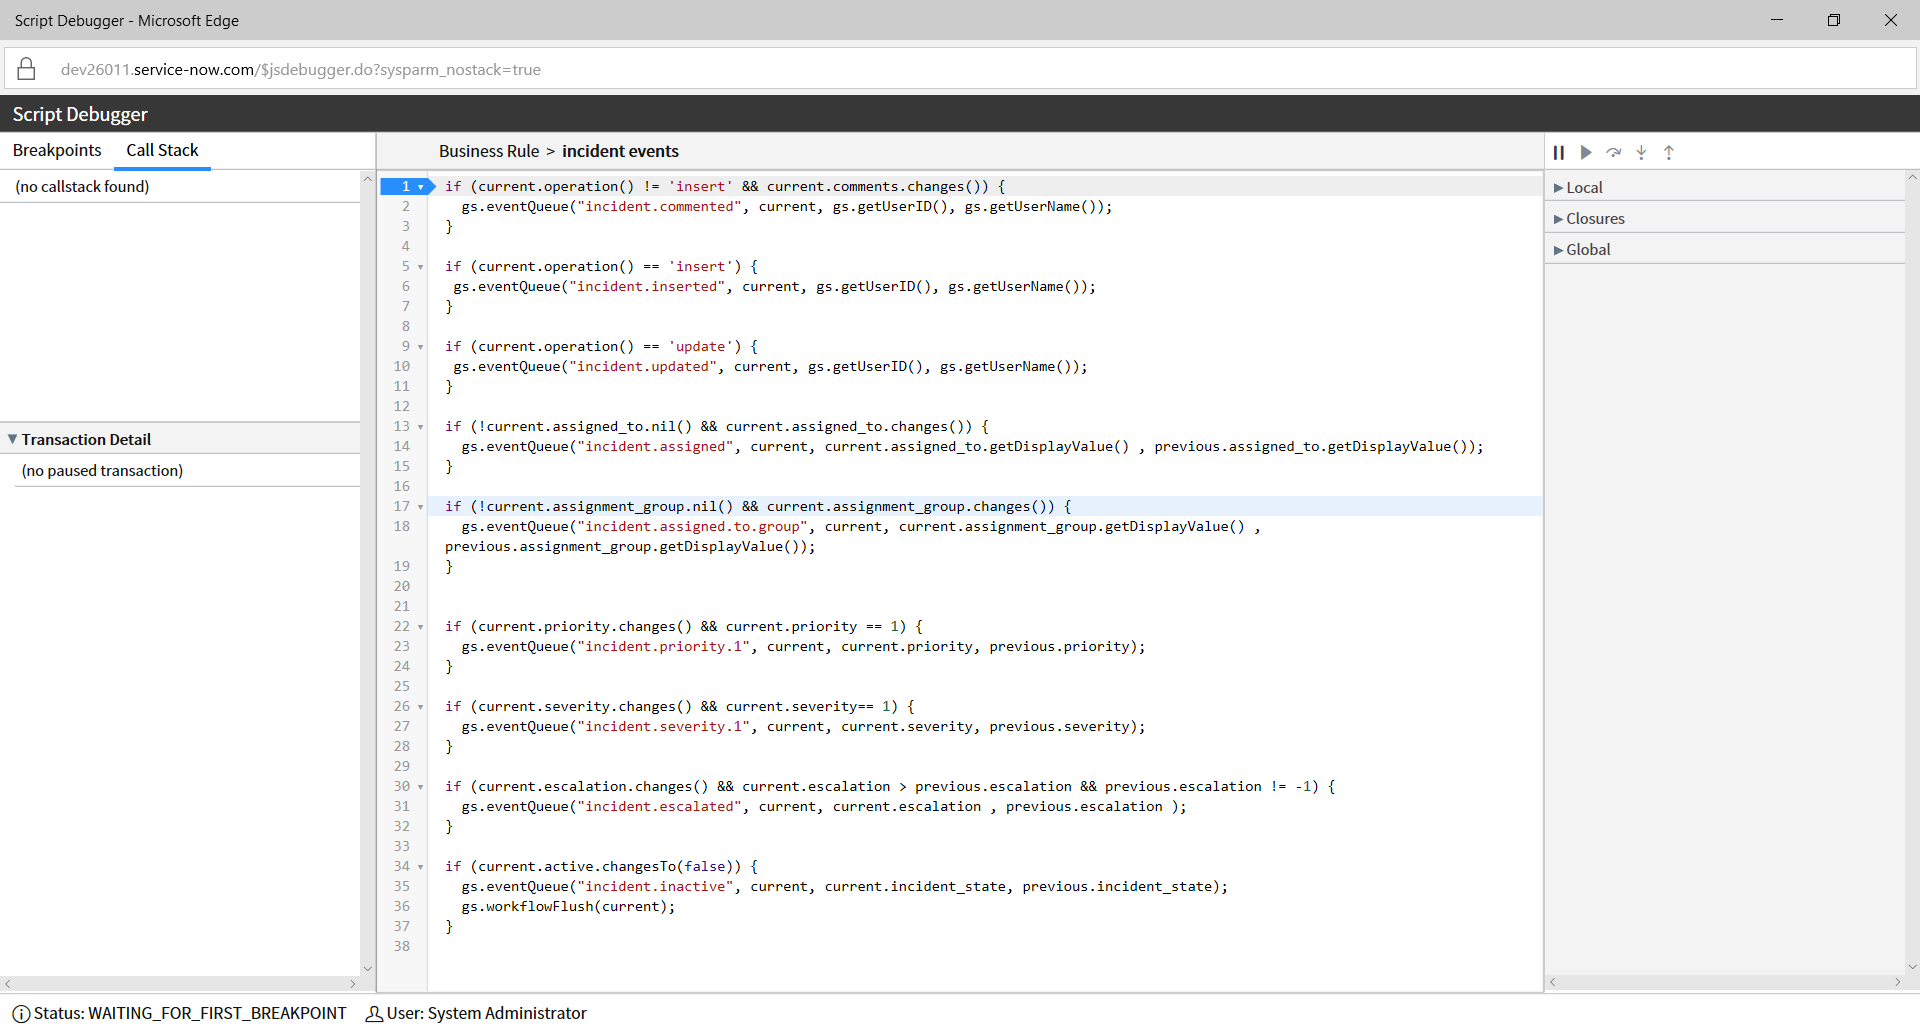
Figure 5.5: Script debugger stepping through the incident events business rule
Once the debugger is opened, trigger the script, ...

