QlikView extensions and the cycle plot
If we are going to work with advanced data visualization in QlikView, we have to get used to working with extensions. We can either develop the QlikView extension ourselves or use open source extensions that are available in Qlik Branch (http://branch.qlik.com).
For example, we are presented with the challenge to find a better way to visualize year-over-year (YoY), week-over-week (WoW), or any other period-over-period analysis. The following line chart demonstrates how difficult it can be to compare a large number of periods:
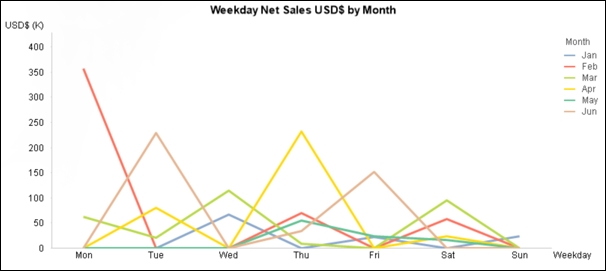
A cycle plot (Cleveland, Dunn, and Terpenning, 1978) offers a alternate way to compare ...
Get Mastering QlikView Data Visualization now with the O’Reilly learning platform.
O’Reilly members experience books, live events, courses curated by job role, and more from O’Reilly and nearly 200 top publishers.

