A 3D plot of a surface
We'll now plot a 3D plot, where the Sin function is plotted against the sum of the square values of the two axes:
>>> from mpl_toolkits.mplot3d import Axes3D
>>> fig = plt.figure()
>>> ax = Axes3D(fig)
>>> X = np.arange(-4, 4, 0.25)
>>> Y = np.arange(-4, 4, 0.25)
>>> X, Y = np.meshgrid(X, Y)
>>> R = np.sqrt(X**2 + Y**2)
>>> Z = np.sin(R)
>>> ax.plot_surface(X, Y, Z, rstride=1, cstride=1, cmap='hot')
After the preceding code is executed we'll get the following output:
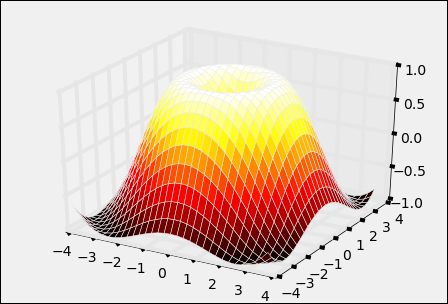
In the preceding code, we defined the x and y axes with values ranging from -4 to 4. We created a coordinate matrix with meshgrid(), then squared the values of ...
Get Mastering Python for Data Science now with the O’Reilly learning platform.
O’Reilly members experience books, live events, courses curated by job role, and more from O’Reilly and nearly 200 top publishers.

