Area plots
An area plot is useful for comparing the values of different factors across a range. The area plot can be stacked in nature, where the areas of the different factors are stacked on top of each other. The following code gives an example of a stacked area plot:
>>> df = pd.DataFrame(np.random.rand(10, 4), columns=['p', 'q', 'r', 's'])

>>> df.plot(kind='area');
After the preceding code is executed we'll get the following output:
To remove the stack of area plot, you can use the following code:
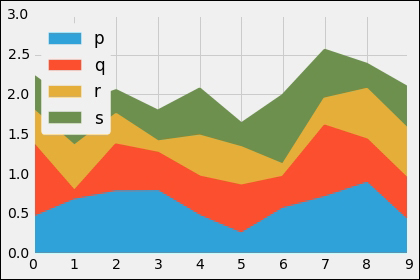
>>> df.plot(kind='area', stacked=False);
After the preceding code is executed we'll get the following output:
Get Mastering Python for Data Science now with the O’Reilly learning platform.
O’Reilly members experience books, live events, courses curated by job role, and more from O’Reilly and nearly 200 top publishers.

