Playing with text
Adding text to your chart can be done by using a simple matplotlib function. You only have to use the text() command to add it to the chart:
>>> # Playing with text
>>> n = np.random.random_sample((5,))

>>> plt.bar(np.arange(len(n)), n)
>>> plt.xlabel('Indices')
>>> plt.ylabel('Value')
>>> plt.text(1, .7, r'$\mu=' + str(np.round(np.mean(n), 2)) + ' $')

>>> plt.show()
In the preceding code, the text() command is used to add text within the plot:
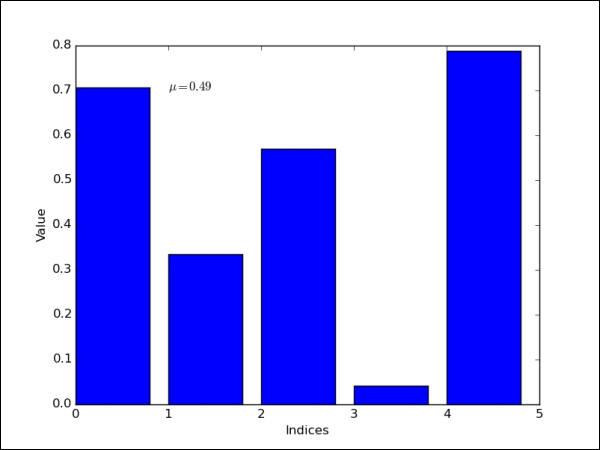
The first parameter takes the x axis value and the second parameter takes the y axis value. The third parameter is the text that needs to be added to the plot. The latex expression has been ...
Get Mastering Python for Data Science now with the O’Reilly learning platform.
O’Reilly members experience books, live events, courses curated by job role, and more from O’Reilly and nearly 200 top publishers.

