Debugging from the console
When playing around with new libraries in the REPL, it can be very useful to have a debugger to help you understand it better. You can directly connect your debugger to the REPL and hence, set breakpoints and break on exceptions:
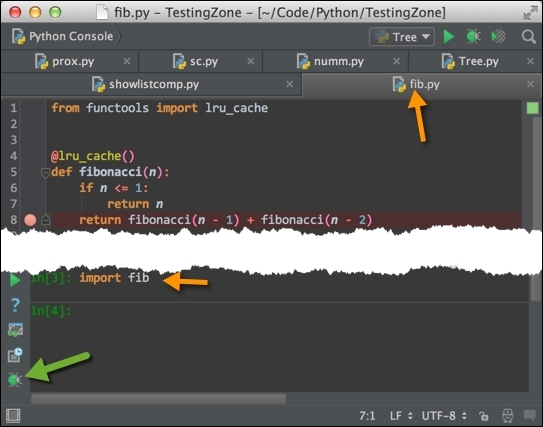
We're importing fib first (which is in our PYTHONPATH; in other words, in the root directory of the project), we set a breakpoint in the fibonacci function's recursive call, and we click on the button indicated by the green arrow. If we call the fibonacci function now from our REPL, we will see that the Python debugger suspends on the line indicated. So, first we import the file we want to test ...
Get Mastering PyCharm now with the O’Reilly learning platform.
O’Reilly members experience books, live events, courses curated by job role, and more from O’Reilly and nearly 200 top publishers.

