Slicer visuals represent a central element of self-service functionality in Power BI in addition to the Visual interactions behavior described in the previous section. The standard slicer visual displays the unique values of a single column enabling report users to apply their own filter selections. Additionally, Power BI Desktop provides several formatting and filter condition options available based on the data type of the column. The following image contains three sample slicer visuals with each slicer representing a different data type (text, number, date):
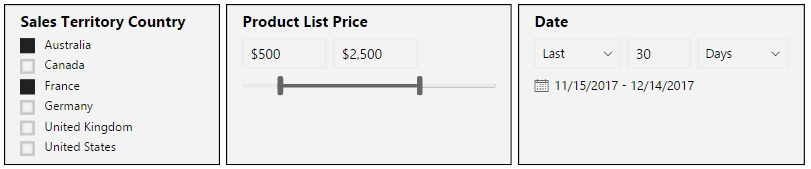
Slicer visuals
In this example, the three slicers filter for two sales ...

