Quick Insight features are enabled in Power BI Desktop by default, allowing users to right-click data points in visuals and execute the relevant analysis. In the following example, the user has right-clicked the data point for 2017-Apr, and as a result, an option to explain the decrease is exposed in the Analyze menu:
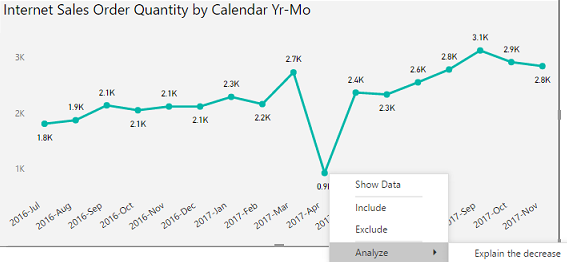
Explaining the decrease in Power BI Desktop
Clicking Explain the decrease executes machine learning algorithms against the dataset and populates a window with visuals representing the insights retrieved. The user can scroll vertically to view the different insights obtained such as the Customer ...

