Formatting visuals primarily refer to modifying the format properties of a visual via the format cards associated with that visual. Additionally, report authors can use the options exposed on the Format tab in the Report View of Power BI Desktop to control the alignment, distribution, and Z-position of visuals.
Whenever a visual is selected on the canvas, the Format pane presents a number of formatting cards specific to the visual. In the following image, the 10 formatting cards currently available to the Power BI column chart visual are displayed:
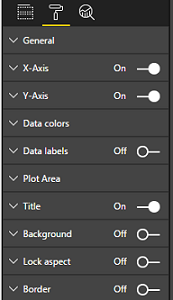
Visual formatting cards
Expanding and enriching the available formatting ...

