Chart visuals can broadly be categorized into the following four types of data relationships:
- Comparison: How items compare against each other or over time
- Relationship: How items relate (or correlate) to one another across multiple variables
- Distribution: The most common values for a variable and the concentration of values within a range
- Composition: The portion of a total that an item represents relative to other items, possibly over time
The following table associates specific visuals to these categories and briefly describes their top use cases:
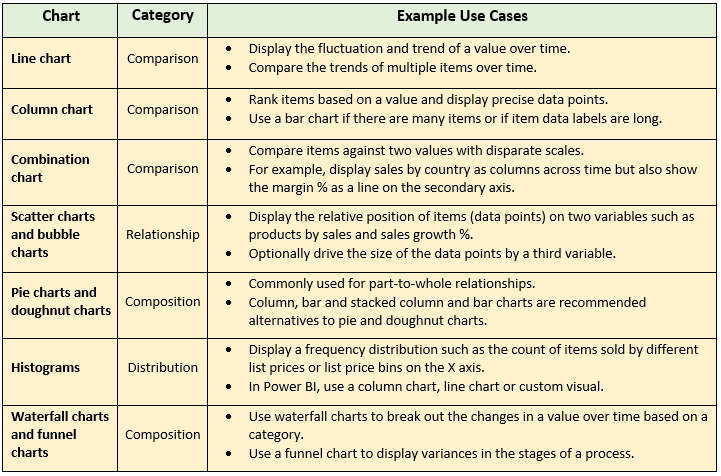
Chart visuals by category
As a table of chart types, map visuals, and the ...

