An additional and highly requested enhancement to matrix visuals is the ability to show measures as rows. The following matrix visual breaks out six DAX measures by a date hierarchy across the columns:
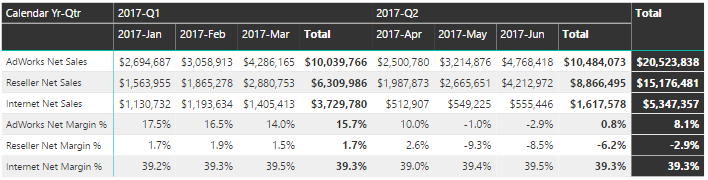
Values on rows in matrix visual
Displaying multiple measures as rows, particularly with one or multiple date dimension fields across the columns, is a very common layout for Excel pivot table reports. To enable this feature in Power BI, simply enable the Show on rows feature within the values formatting card of the matrix visual.

