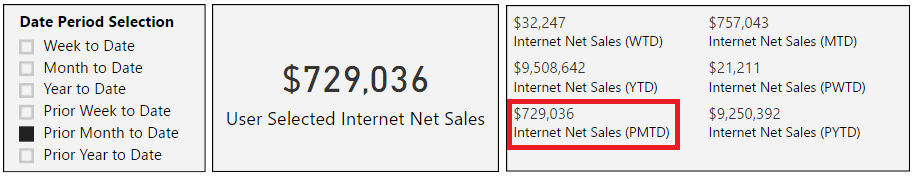
A powerful use case for slicer visuals is to expose a custom list of parameter values and drive one or multiple DAX measures based on the user's selection. In the following example, a slicer visual contains six date intelligence periods and a custom DAX measure references the date intelligence measure corresponding to the user's selection:
Slicer as a measure parameter
The table used for the slicer values could be defined within a source system and retrieved during data refresh like other tables. Alternatively, since the parameter values are unlikely to change, the table could be created within Power BI Desktop and ...

