Conditional formatting can be applied to column charts by specifying a measure, such as product margin in the color saturation field well. By default, the value of this measure will drive the saturation of color for each column in the visual. To take further control of the formatting or to apply a conditional formatting rule, the Diverging formatting options under the Data colors card can be modified.
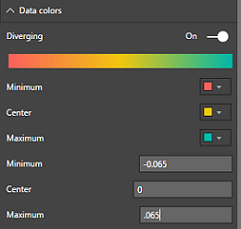
In the following example of a column chart, a product margin percentage measure is used as the Color saturation field (above tooltips) and threshold values have been entered to define the formatting rule: