These two activations are very similar but with an important difference. Let's start defining them:

The corresponding plots are shown in the following diagram:
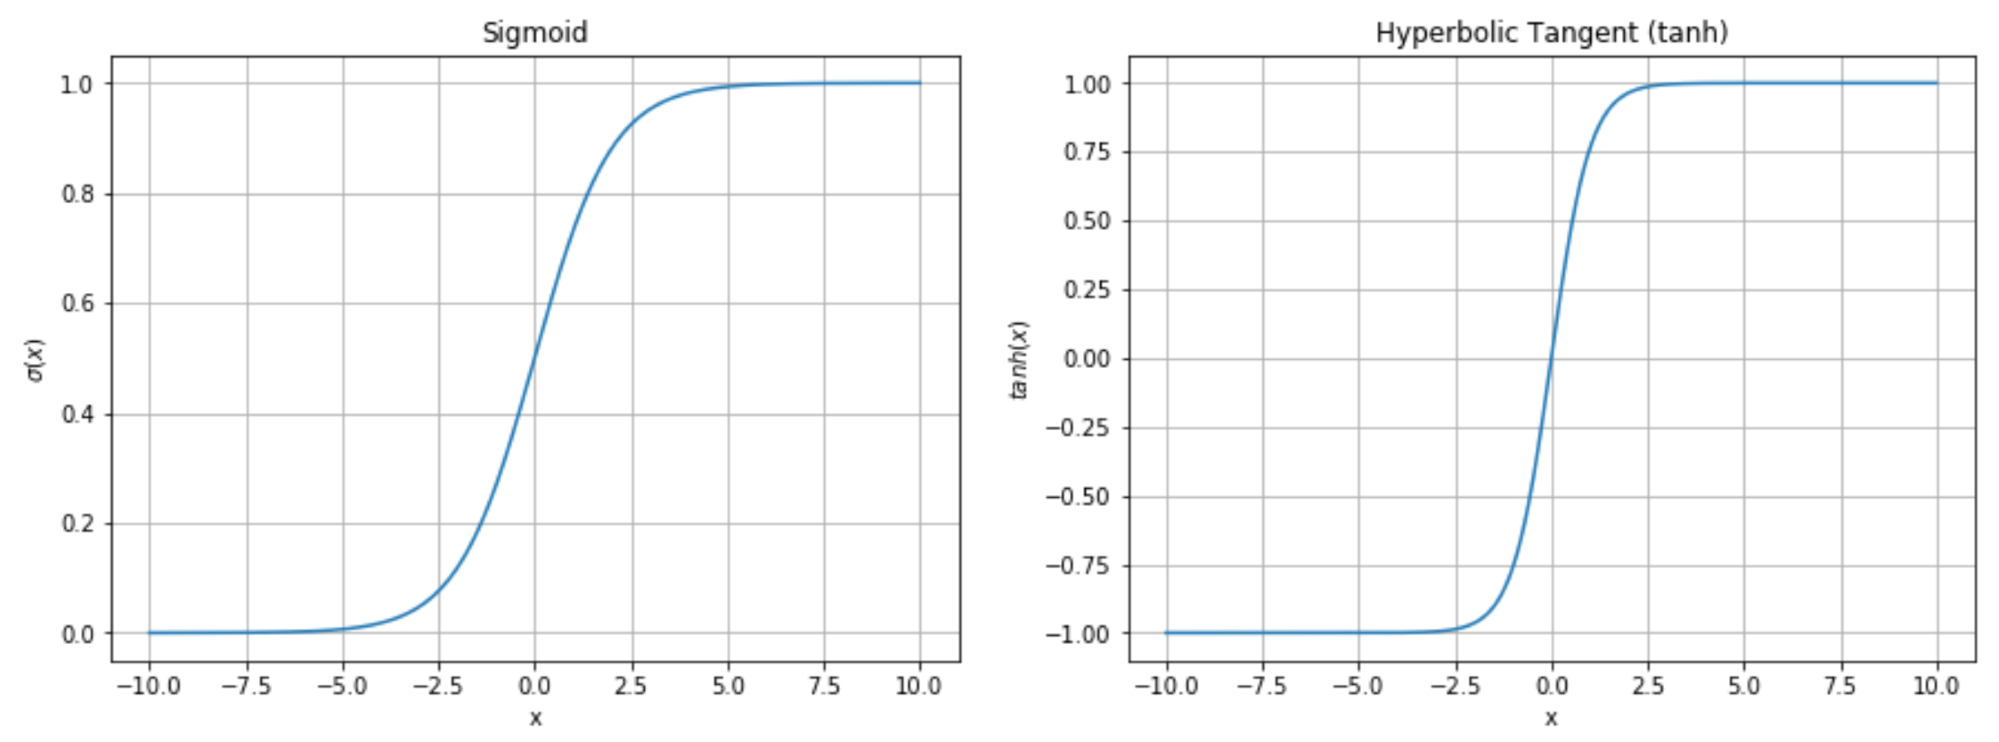
Sigmoid and hyperbolic tangent plots
A sigmoid σ(x) is bounded between 0 and 1, with two asymptotes (σ(x) → 0 when x → -∞ and σ(x) → 1 when x → ∞). Similarly, the hyperbolic tangent (tanh) is bounded between -1 and 1 with two asymptotes corresponding to the extreme values. Analyzing the two plots, we can discover that both functions are almost linear in ...

