Let's apply this algorithm to the same dataset using the Scikit-Learn class SpectralEmbedding, with n_components=2 and n_neighbors=15:
from sklearn.manifold import SpectralEmbeddingse = SpectralEmbedding(n_components=2, n_neighbors=15)X_se = se.fit_transform(faces['data'])
The resulting plot (zoomed in due to the presence of a high-density region) is shown in the following graph:
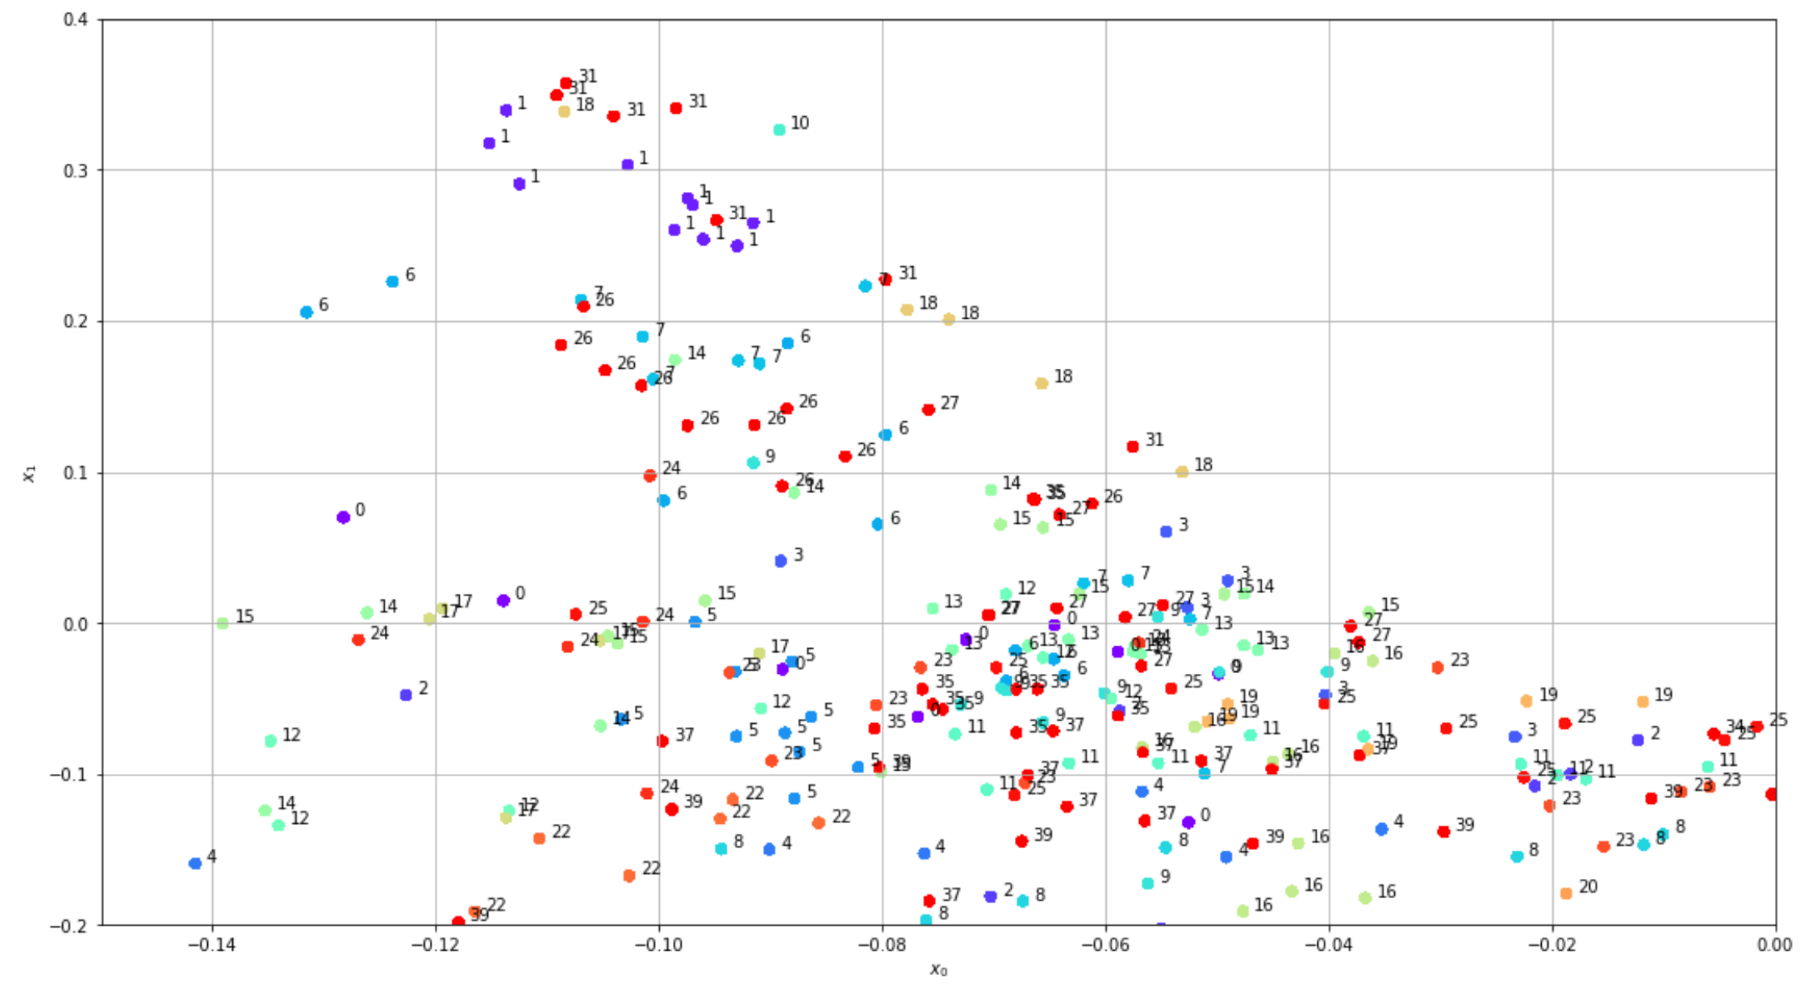
Laplacian Spectral Embedding applied to the Olivetti faces dataset
Even in this case, we can see that some classes are grouped into small clusters, but at the same time, we observe many agglomerates where there are mixed samples. ...

