LineChart is very similar to a mathematical graph of a function. It requires a few more entities to set up:
- Axes represent vertical and horizontal data
- Series is a set of data shown by one line
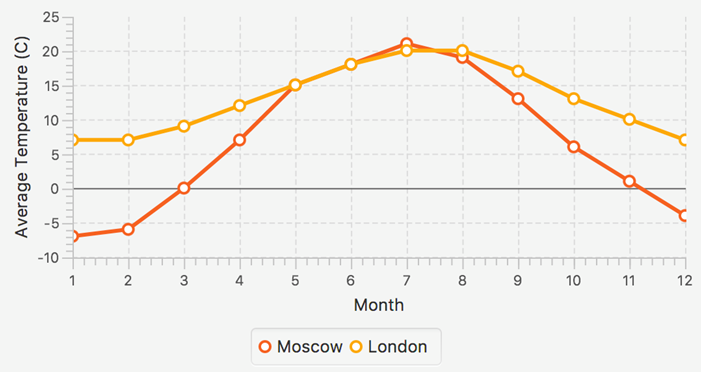
For example, in the next screenshot:
- The horizontal axis (or x-axis) represents months of the year
- The vertical axis (or y-axis) shows average temperature in that month
- Each series is a different city's data:
Let's start with the code for axis:
// chapter10/chart/LineChartDemo.java// Months from 1 to 12 with a tick for each oneNumberAxis axisX = new NumberAxis("Month", 1, 12, 1);// We can skip boundaries and chart will calculate ...
