Configuring the default Data Graphics
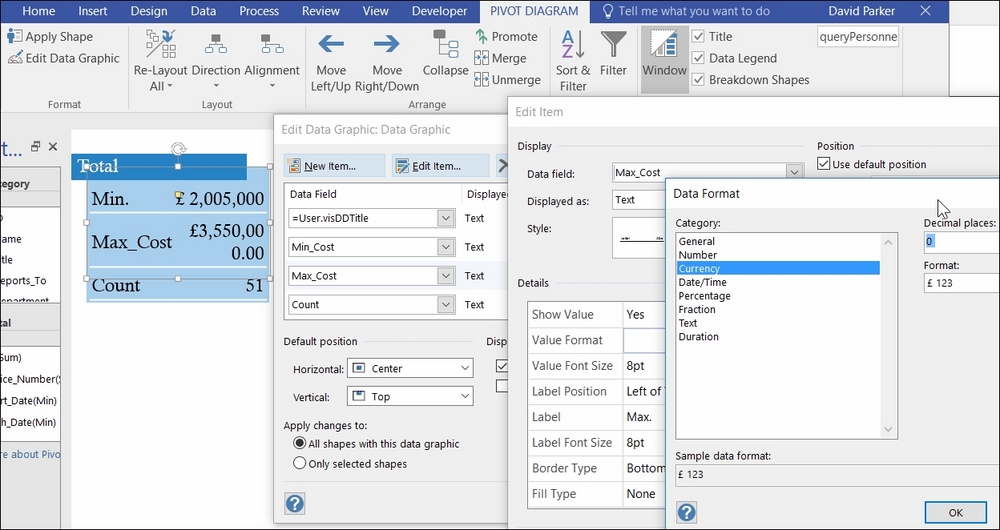
The Pivot Node shapes just use the normal Data Graphics features that were described in Chapter 4, Using the Built-In Data Graphics, so they can be configured in just the same way, as shown in the following screenshot:
Get Mastering Data Visualization with Microsoft Visio Professional 2016 now with the O’Reilly learning platform.
O’Reilly members experience books, live events, courses curated by job role, and more from O’Reilly and nearly 200 top publishers.

