Visualizing point data in space
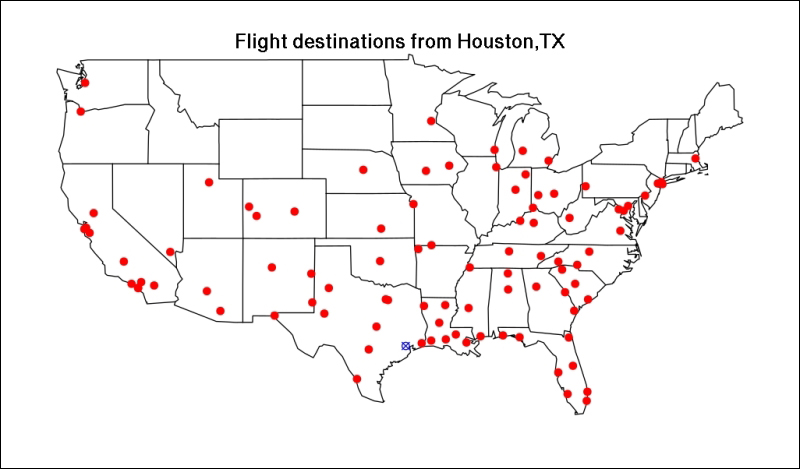
For the first time, let's keep it simple and load some package-bundled polygons as the base map. To this end, we will use the maps package. After loading it, we use the map function to render the polygons of the United States of America, add a title, and then some points for the airports and also for Houston with a slightly modified symbol:
> library(maps)
> map('state')
> title('Flight destinations from Houston,TX')
> points(h$lon, h$lat, col = 'blue', pch = 13)
> points(dt$lon, dt$lat, col = 'red', pch = 19)
And showing the airport names on the plot is pretty easy as well: we can use the well-known functions from ...
Get Mastering Data Analysis with R now with the O’Reilly learning platform.
O’Reilly members experience books, live events, courses curated by job role, and more from O’Reilly and nearly 200 top publishers.

