Basic visualization (graphs)
Graphs allow the user to analyze data quickly by providing a visual view of data. In MicroStrategy, there are a number of graph styles, such as vertical, polar, bubble and so on, depending on the user's needs. The following screenshot shows the types of graph in MicroStrategy:
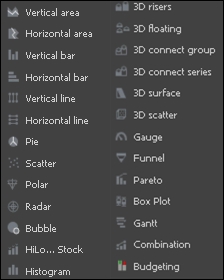
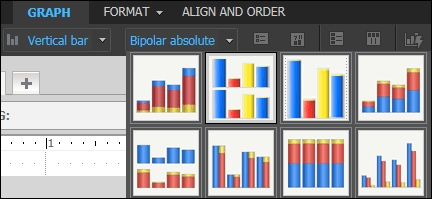
These graphs can have further subtypes; a Vertical bar graph can be further divided into absolute, clustered, stacked, and so on:
Steps to add a graph are as follows:
- Open the document in design mode.
- Click INSERT | GRAPH and select the appropriate ...
Get Mastering Business Intelligence with MicroStrategy now with the O’Reilly learning platform.
O’Reilly members experience books, live events, courses curated by job role, and more from O’Reilly and nearly 200 top publishers.

