Chapter 1. Enterprise Analytics Fundamentals
In this chapter we’ll review the fundamentals of enterprise analytic architectures. We will introduce the analytics data pipeline, a fundamental process that takes data from its source through several steps until it is available to analytics clients. Then we will introduce the concept of a data lake, as well as two different pipeline architectures: lambda architecture and kappa architecture. The particular steps in the typical data processing pipeline (as well as considerations around the handling of “hot” and “cold” data) are detailed and serve as a framework for the rest of the book. We conclude the chapter by introducing our case study scenarios, along with their respective data sets, which provide a more real-world context for performing big data analytics on Azure.
The Analytics Data Pipeline
Data does not end up nicely formatted for analytics on its own; it takes a series of steps that involve collecting the data from the source, massaging the data to get it into the forms appropriate to the analytics desired (sometimes referred to as data wrangling or data munging), and ultimately pushing the prepared results to the location from which they can be consumed. This series of steps can be thought of as a pipeline.
The analytics data pipeline forms a basis for understanding any analytics solution, and thus is very useful to our purposes in this book as we seek to understand how to accomplish analytics using Microsoft Azure. As shown in Figure 1-1, the analytics data pipeline consists of five major components, which are useful in comprehending and designing any analytics solution.
- Source
-
The location from which new raw data is pulled or which pushes new raw data into the pipeline.
- Ingest
-
The computation that handles receiving the raw data from the source so that it can be processed.
- Processing
-
The computation controlling how the data gets prepared and processed for delivery.
- Storage
-
The various locations where the ingested, intermediate, and final calculations are stored. Storage can be transient (the data lives in memory only for a finite period of time) or persistent (the data is stored for the long term).
- Delivery
-
How the data is ultimately presented to the consumer, which can run the gamut from dedicated analytics client solutions used by analysts to APIs that enable the results to integrate into a larger solution or be consumed by other processes.
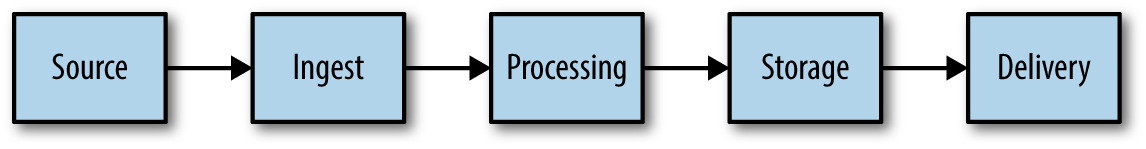
Figure 1-1. The data analytics pipeline is a conceptual framework that is helpful in understanding where various data technologies apply.
Data Lakes
The term data lake is becoming the latest buzzword, and is following a path similar to how big data grew in popularity, and at the same time its definition has become more unclear as vendors attach the meaning that suits their products best. So let’s begin by defining the concept of a data lake.
A data lake consists of two parts: storage and processing. Data lake storage requires an infinitely scalable, fault-tolerant, storage repository designed to handle massive volumes of data with varying shapes, sizes, and ingest velocities. Data lake processing requires a processing engine that can successfully operate on the data at this scale.
The term data lake was originally coined by James Dixon, the CTO of Pentaho, wherein he used the term in contrast with the traditional, highly schematized datamart:
If you think of a datamart as a store of bottled water—cleansed and packaged and structured for easy consumption—the data lake is a large body of water in a more natural state. The contents of the lake stream in from a source to fill the lake, and various users of the lake can come to examine, dive in, or take samples.
In this definition, a data lake is a repository that intentionally leaves the data in its raw or least-processed form to allow questions to be asked of it that would not be answerable if the data were packaged into a particular structure or otherwise aggregated.
That simple definition of a data lake should serve as the core, but as you will see in reading this book, it belies the true extent of a data lake. In reality, a data lake includes not just a single processing engine, but multiple processing engines, and because it represents the enterprise-wide, centralized repository of source and processed data (after all, it champions a “store all” approach to data management), it has other requirements such as metadata management, discovery, and governance.
One final important note: the data lake concept as it is used today is intended for batch processing, where high latency (time until results ready) is appropriate. That said, support for lower-latency processing is a natural area of evolution for data lakes, so this definition may evolve with the technology landscape.
With this broad definition of data lake, let us look at two different architectures that can be used to act on the data managed by a data lake: lambda architecture and kappa architecture.
Lambda Architecture
Lambda architecture was originally proposed by the creator of Apache Storm, Nathan Marz. In his book, Big Data: Principles and Best Practices of Scalable Realtime Data Systems (Manning), he proposed a pipeline architecture that aims to reduce the complexity seen in real-time analytics pipelines by constraining any incremental computation to only a small portion of this architecture.
In lambda architecture, there are two paths for data to flow in the pipeline (see Figure 1-2):
-
A “hot” path where latency-sensitive data (e.g., the results need to be ready in seconds or less) flows for rapid consumption by analytics clients
-
A “cold” path where all data goes and is processed in batches that can tolerate greater latencies (e.g., the results can take minutes or even hours) until results are ready
When data flows into the “cold” path, this data is immutable. Any changes to the value of particular datum are reflected by a new, timestamped datum being stored in the system alongside any previous values. This approach enables the system to re-compute the then-current value of a particular datum for any point in time across the history of the data collected. Because the “cold” path can tolerate a greater latency until the results are ready, the computation can afford to run across large data sets, and the types of calculation performed can be time-intensive. The objective of the “cold” path can be summarized as: take the time you need, but make the results extremely accurate.
When data flows into the “hot” path, this data is mutable and can be updated in place. In addition, the hot path places a latency constraint on the data (as the results are typically desired in near–real time). The impact of this latency constraint is that the types of calculations that can be performed are limited to those that can happen quickly enough. This might mean switching from an algorithm that provides perfect accuracy to one that provides an approximation. An example of this involves counting the number of distinct items in a data set (e.g., the number of visitors to your website): you can either count each individual datum (which can be very high latency if the volume is high) or you can approximate the count using algorithms like HyperLogLog. The objective of the hot path can be summarized as: trade off some amount of accuracy in the results in order to ensure that the data is ready as quickly as possible.
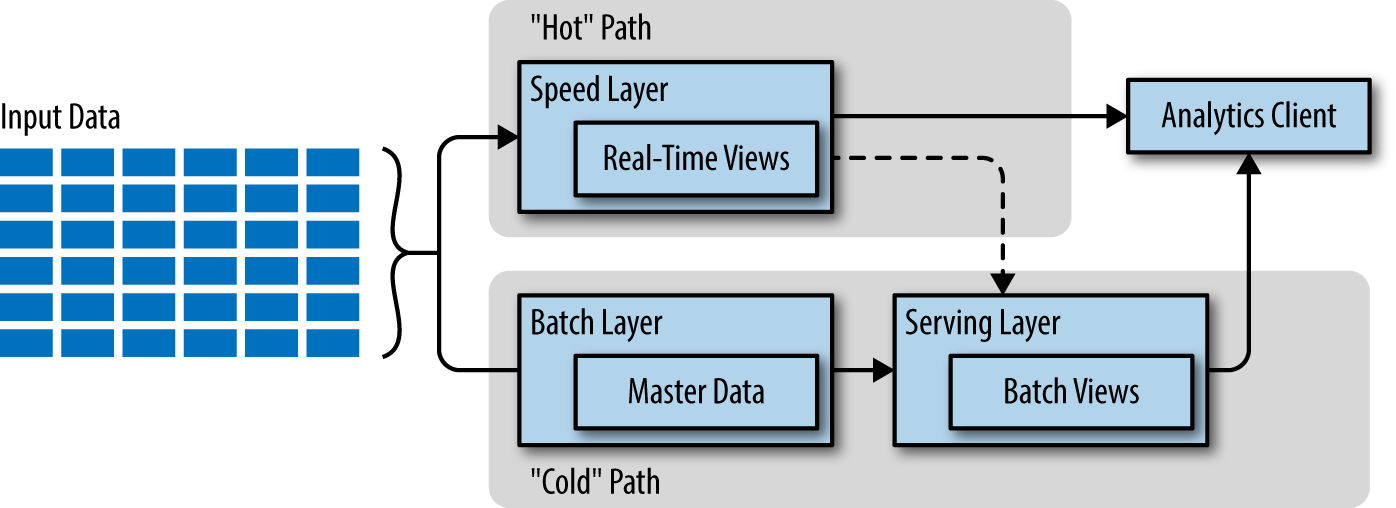
Figure 1-2. The lambda architecture captures all data entering the pipeline into immutable storage, labeled “Master Data” in the diagram. This data is processed by the batch layer and output to a serving layer in the form of batch views. Latency-sensitive calculations are applied on the input data by the speed layer and exposed as real-time views. Analytics clients can consume the data from either the speed layer views or the serving layer views depending on the time frame of the data required. In some implementations, the serving layer can host both the real-time views and the batch views.
The hot and cold paths ultimately converge at the analytics client application. The client must choose the path from which it acquires the result. It can choose to use the less accurate but most up-to-date result from the hot path, or it can use the less timely but more accurate result from the cold path. An important component of this decision relates to the window of time for which only the hot path has a result, as the cold path has not yet computed the result. Looking at this another way, the hot path has results for only a small window of time, and its results will ultimately be updated by the more accurate cold path in time. This has the effect of minimizing the volume of data that components of the hot path have to deal with.
The motivation for the creation of the lambda architecture may be surprising. Yes, enabling a simpler architecture for real-time data processing was important, but the reason it came into existence was to provide human fault tolerance. In effect, it recognizes that we are moving to a time when we actually can keep all the raw data. Simultaneously, it recognizes that bugs happen, even in production. Lambda architectures offer a solution that is not just resilient to system failure, but tolerant of human mistakes because it has all the input data and the capability to recompute (through batch computation) any errant calculation.
Kappa Architecture
Kappa architecture surfaced in response to a desire to simplify the lambda architecture dramatically by making a single change: eliminate the cold path and make all processing happen in a near–real-time streaming mode (Figure 1-3). Recomputation on the data can still occur when needed; it is in effect streamed through the kappa pipeline again. The kappa architecture was proposed by Jay Kreps based on his experiences at LinkedIn, and particularly his frustrations in dealing with the problem of “code sharing” in lambda architectures—that is, keeping in sync the logic that does the computation in the hot path with the logic that is doing the same calculation in the cold path.
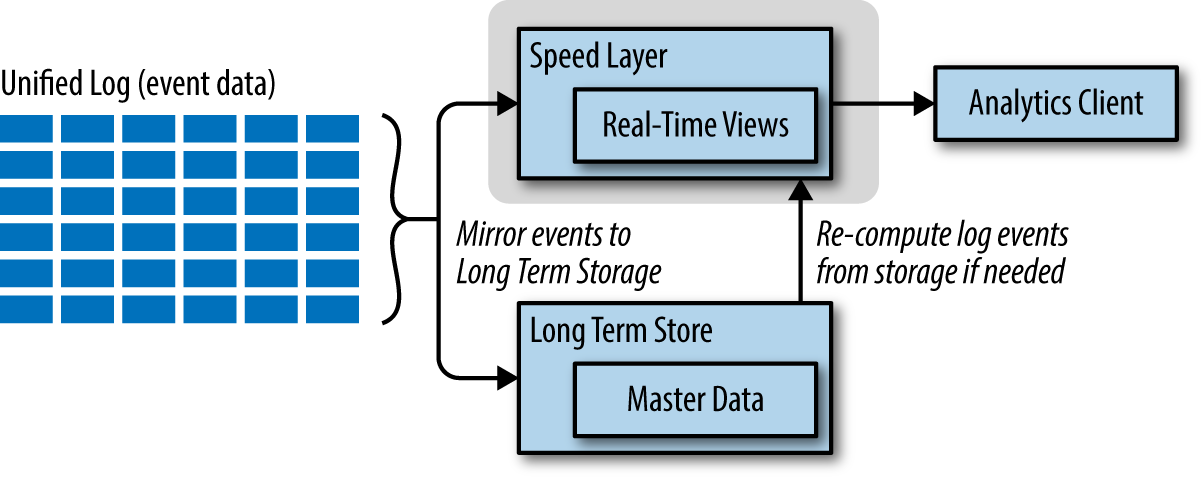
Figure 1-3. In the kappa architecture, analytics clients get their data only from the speed layer, as all computation happens upon streaming data. Input events can be mirrored to long-term storage to enable recomputation on historical data should the need arise.
Kappa architecture centers on a unified log (think of it as a highly scalable queue), which ingests all data (which are considered events in this architecture). There is a single deployment of this log in the architecture, whereby each event datum collected is immutable, the events are ordered, and the current state of an event is changed only by a new event being appended.
The unified log itself is designed to be distributed and fault tolerant, suitable to its place at that heart of the analytics topology. All processing of events is performed on the input streams and persisted as a real-time view (just as in the hot path of the lambda architecture). To support the human-fault-tolerant aspects, the data ingested from the unified log is typically persisted to a scalable, fault-tolerant persistent storage so that it can be recomputed even if the data has “aged out” of the unified log.
Kreps on Kappa
If you’re interested in reading more about kappa architecture, take a look at I Heart Logs by Jay Kreps (O’Reilly), as Kreps applied it toward event log processing and analytics.
If this architecture sounds vaguely familiar to you, it is probably because it is. The patterns employed by the kappa architecture are the same as those you may have come across if you have used the Event Sourcing pattern or CQRS (command query responsibility segregation).
Choosing Between Lambda and Kappa
Arguing the merits of lambda architecture over kappa architecture and vice versa is akin to arguing over programming languages—it quickly becomes a heated, quasi-religious debate. Instead, for the purposes of this book we aim to use both architectures as motivations to illustrate how you can design and implement such pipelines in Microsoft Azure. We leave it to you, the reader, to decide which architecture most closely matches the needs of your analytics data pipeline.
The Azure Analytics Pipeline
In this book we will expand on the analytics data pipeline to understand the ways we can build the one required by a particular scenario. We attempt to do this in two directions: first, by broadly showing the lay of the land for all the Azure services in the context of where they apply to the pipeline; and second, by taking on specific scenarios that enable us to apply a subset of the services in implementing a solution for that scenario. We will explore the concepts of data lakes, lambda architectures, and kappa architectures in our solutions, and show how we can achieve them using the latest services from Microsoft Azure.
Throughout this book, we will tease out the analytics data pipeline into more and more granular components, so that we can categorically identify the Azure services that act in support of a particular component. We will expand our analytics data pipeline (source, ingest, storage, processing, delivery) with the following sub-components, as illustrated by Figure 1-4.
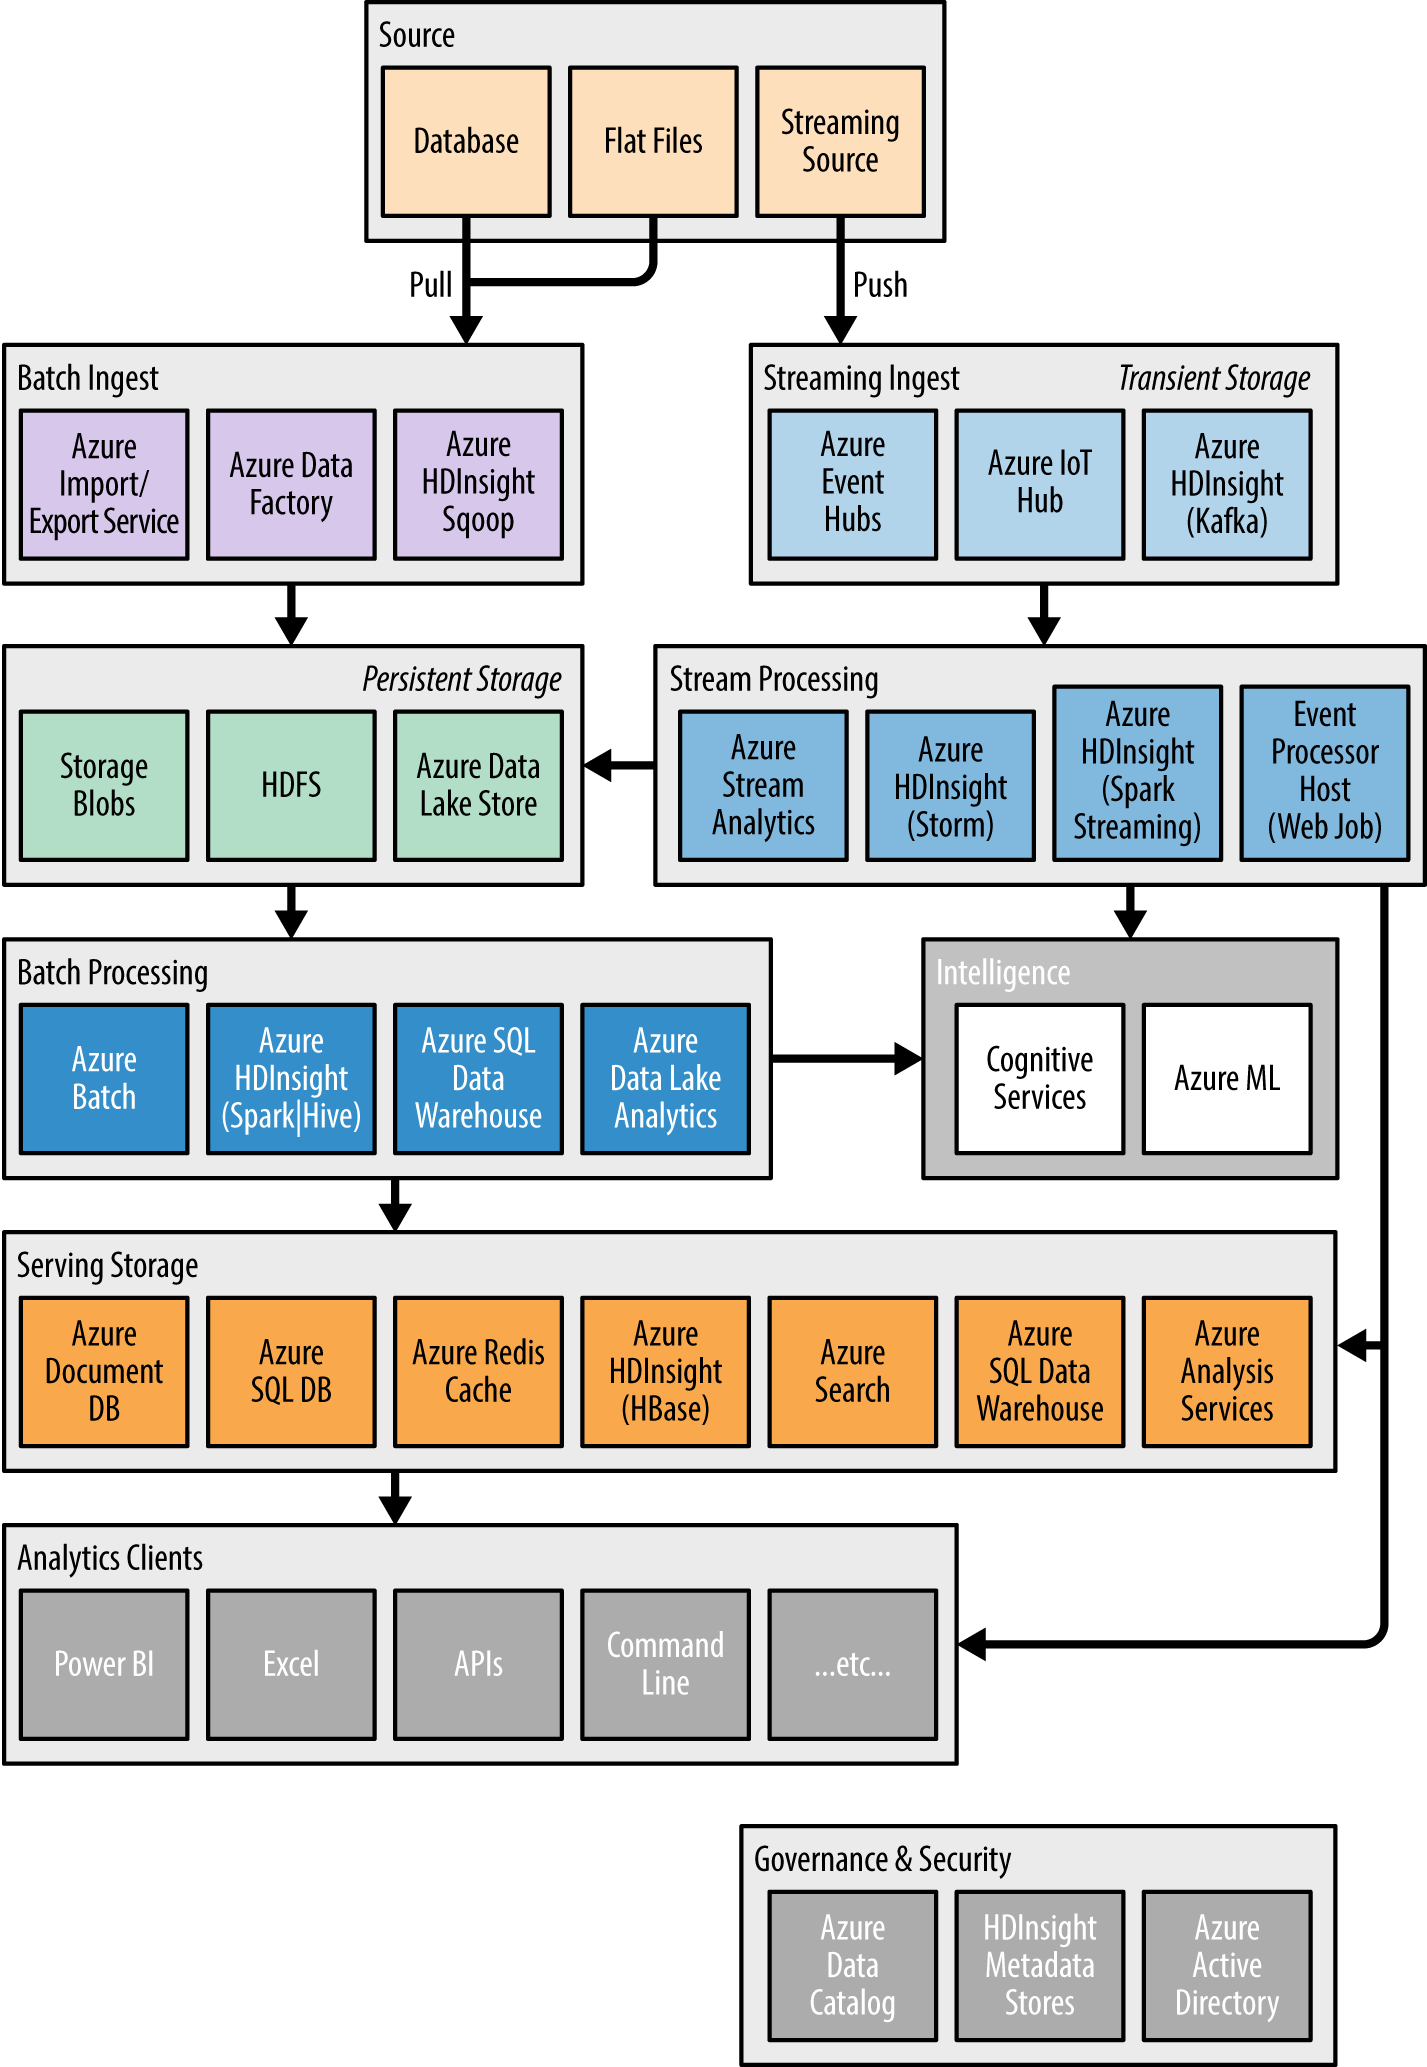
Figure 1-4. The Azure analytics pipeline we explore in this book, showing the various Azure services in the context of the component they support.
- Source
-
For the purposes of this book, we will look at three different source types: an on-premises database like SQL Server, on-premises files (like CSVs in a file share), and streaming sources that periodically transmit data (such as logging systems or devices emitting telemetry).
- Ingest
-
In Chapter 2, we cover the components that act in support of getting data to the solution, either through batch ingest (bulk data loading) or via streaming ingest. We will examine loading from sources that use push-based approaches to ingest, such as receiving streaming messages into Azure Event Hubs or IoT Hub. We will also examine pull-based approaches, such as using the Azure Import/Export Service to send a disk full of files to Azure Storage or using Azure Data Factory agents to query data from an on-premises source.
- Storage
-
In Chapter 3 we explore the components that are used to store the ingested, intermediate, and final data, such as queue-based and file-based approaches. We place the storage options in three different contexts: transient storage, persistent storage, and serving storage.
- Transient storage
-
This can take the form of multiconsumer queues with a duration-based expiry to their content, as in Event Hubs and IoT Hub.
- Persistent storage
-
These components are capable of storing their content indefinitely and at scale, as seen in Azure Blob Storage, HDFS, and Azure Data Lake Store.
- Serving storage
-
In Chapters 7 and 8 we will also cover storage that is optimized for serving results to the ultimate client of the analytics processing pipeline, generally to support flexible, low-latency querying scenarios. In some cases, this might be the direct landing point for data processed in real time; in other cases, these serving storage services are the repository for the results of time-consuming computation coming from batch processing. Among these components, we cover Azure Document DB, Azure SQL Database, Azure SQL Data Warehouse, Azure Redis Cache, Azure Search, and HDInsight running HBase.
- Processing
-
In Chapters 4–8, we cover the components that process and transform the ingested data and generate results from queries. We explore the gamut of latencies, from the high-latency computations of batch processing, to the shorter latencies expected with interactive querying, to the shortest latencies of real-time processing. With batch processing we will look at Azure HDInsight running Spark or using Hive to resolve queries, and we will take a similar approach to applying SQL Data Warehouse (and its PolyBase technology) to query batch storage. Then, we will look at the unified capabilities that Azure Data Lake Analytics brings to batch processing and querying. Finally, we will cover the MPP option Azure offers for batch computation, in the form of Azure Batch, as well as how to apply Azure Machine Learning in batches against data from batch storage.
- Delivery
-
The analytics tools covered in Chapter 12 actually perform the analytics functions, and some of them can acquire their data directly from the real-time pipeline, such as Power BI. Other analytics tools rely on serving storage components, such as Excel, custom web service APIs, Azure Machine Learning web services, or the command line.
Governance components allow us to manage the metadata for items in our solution as well as control access and secure the data. These include the metadata functionality provided by Azure Data Catalog and HDInsight. They are covered in Chapter 10.
Introducing the Analytics Scenarios
To motivate the solution design, selection, and application of Azure services throughout the book, we will walk through a case-study scenario for a fictitious business, Blue Yonder Airports. Following the process of creating a solution from the case study will provide you with some of the “real-world” challenges you are likely to face in your implementations.
Let’s imagine that Blue Yonder Airports (BYA) provides systems for airports that improve passengers’ experience while they are in the airport. BYA services many of the larger airports, primarily in the United States, and provides them with logistics software that helps them “orchestrate the chaos” of moving passengers through the airport.
The Federal Aviation Administration (FAA) classifies airports that provide scheduled passenger service and serve at least 10,000 passengers per year as commercial primary airports. Commercial primary airports are further classified by the volume of passenger boarding they have per year:
-
Nonhub airports account for at least 10,000 and less than 0.05% of total US passengers boarding.
-
Small hubs account for between 0.05% and 0.25% of all US passenger boarding.
-
Medium hubs account for between 0.25% and 1% of total US passenger boarding.
-
Large hubs account for at least 1% of all US passenger boarding.1
As of 2014 there were 30 large hub and 31 medium hub airports in the United States.2 BYA’s business focuses on optimizing the experience for passengers traveling through many of these medium and large hubs.
To put the volumes in perspective, on any given day in their largest large hub airport, BYA sees upward of 250,000 people through the airport in response to over 1,500 flights per day, and manages the passenger experience at over 400 domestic and international gates.
Of late, BYA has realized they have a significant opportunity to deliver the “intelligent airport” by capitalizing on their existing data assets coupled with newer systems that provide airport telemetry in real time. They want to apply intelligent analytics to the challenges surrounding the gate experience.
They want to maintain passenger comfort while there are passengers waiting at a gate for their departure, or deplaning from an arriving flight, by maintaining an ambient temperature of between 68 and 71 degrees Fahrenheit. At the same time, they want to aggressively avoid running the heating or cooling when there are no passengers at the gate, and they certainly want to avoid the odd situation where the heating and air-conditioning cycle back to back, effectively working against each other.
Today, many of BYA’s airports have their heating and cooling on a fixed schedule, but BYA believes that by having a better understanding of flight delays, being able to reasonably predict departure and arrival delays, and having a strong sensor network, they will be able to deliver the optimal passenger experience while saving the airport money in heating and cooling costs.
Blue Yonder Airports has reviewed their data catalog and identified the following data assets as potentially useful in their solution:
- Flight delays
-
BYA has collected over 15 years of historical, on-time performance data across all airlines. This data includes elements such as the airline, the flight number, the origin and destination airports, departure and arrival times, flight duration and distance, and the specific causes of delay (weather, airline issues, security, etc.).
- Weather
-
BYA relies on weather data for its operational needs. Their flight delay data provides some useful information regarding historical weather conditions for arriving and departing flights, but they also have partnered with a third party to provide them not only current weather conditions, but weather forecasts as well. This data include elements like temperature, wind speed and direction, precipitation, pressure, and visibility.
- Smart building telemetry
-
BYA installs smart meters and gateways that provide real-time telemetry of systems running the airport. Initially, their smart meter telemetry focuses on heating/cooling and motion sensors as they look to optimize costs while maintaining passenger comfort. These provide time series data that includes the temperature from each device at a given point in time, as well as activation/deactivation events for heating/cooling and when motion is triggered.
What You Will Need
To follow along with the examples in this book you will need the following items.
Broadband Internet Connectivity
Many of the examples are performed directly on Azure, so you’ll need at least a stable broadband connection to perform them. Of course, faster connections will certainly be better, especially when you are transferring data sets between your computer and the cloud.
Azure Subscription
A pay-as-you-go subscription or MSDN subscription is highly recommended. A free trial subscription might get you through some of the examples, but you are very likely to exceed the $200 free quota. To see all your options to get started with Azure, visit the Microsoft Azure purchase page.
Visual Studio 2015 with Update 1
Visual Studio 2015 with Update 1 is used with the book’s examples. Any one of the Community, Professional, or Enterprise editions will work.
If you already have Visual Studio 2015 installed, but not Update 1, you can download Update 1 online. Once the download completes, launch the installer and step through the wizard to update your Visual Studio to Update 1.
If you do not have a development machine already set up with Visual Studio and want to get started quickly, you can create a virtual machine (VM) from the Azure Marketplace that has Visual Studio 2015 preinstalled and then remote-desktop into that. Beyond reducing the setup time, most data transfers will benefit (e.g., they will be faster) from running within the Azure data center. Just remember to shut down your VM when you are not actively using it to keep your costs down!
To set up a VM with Visual Studio preinstalled, follow these steps:
-
Navigate to the Azure Portal and log in with the credentials you associated with your subscription.
-
Click New.
-
In the blade that appears, under the New heading there is a search text box with the hint text “Search the marketplace.” Type in
Visual Studio 2015and press return (see Figure 1-5).
Figure 1-5. Searching for Visual Studio 2005 virtual machine images within the Azure Marketplace.
-
The Everything blade will appear with a list of VM images that include Visual Studio 2015. Choose “Visual Studio Community 2015 Update 1 with Azure SDK 2.8 on Windows Server 2012 R2” (see Figure 1-6). If this specific version is not available, choose one with the more recent version of Visual Studio and the Azure SDK.
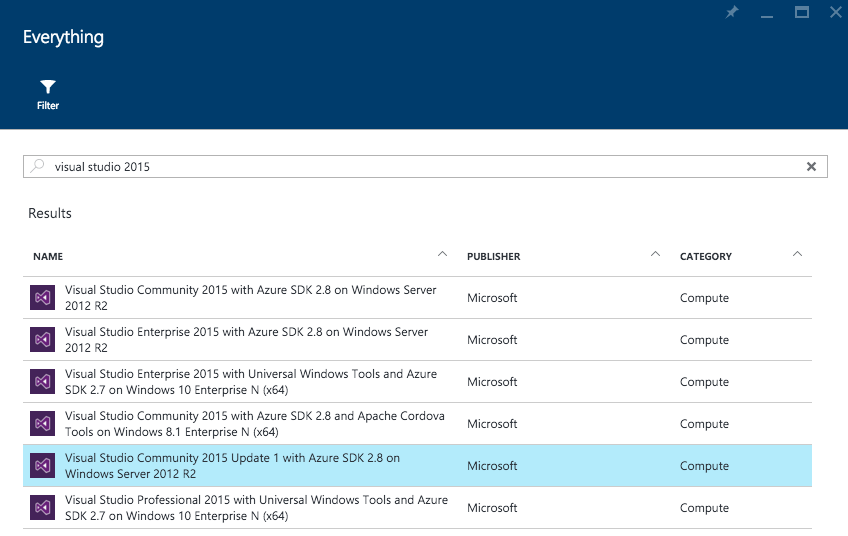
Figure 1-6. Selecting the correct Visual Studio 2015 image from the Azure Marketplace.
-
On the blade that appears, leave “Select a deployment model” set to Resource Manager and click Create.
-
On the Basics blade that appears, provide a name for the VM, the username and password you will use to log in, a resource group name (e.g., “analytics-book”) and the Location that is nearest you (see Figure 1-7).
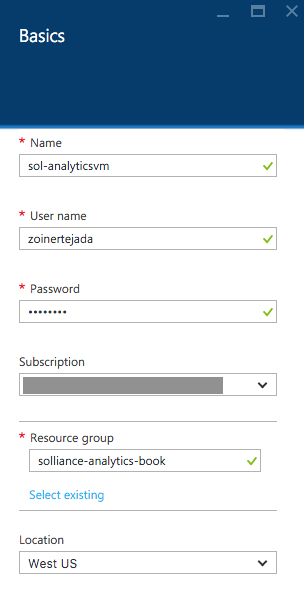
Figure 1-7. Basic configuration of a VM.
-
Click OK.
-
On the “Choose a size” blade, select the instance size for the VM. We recommend an A3 Basic, but any option with at least four cores and 7 GB or RAM will provide a comfortable experience. If you are not seeing the A3 option, click the View All link near the top right of the blade.
-
Click Select.
-
On the Settings blade, leave all the settings at their defaults and click OK.
-
On the Summary blade, click OK to begin provisioning your VM.
-
It may take 7–15 minutes to provision.
-
After the VM is created, the blade for it will appear. Click the Connect button in the toolbar to download the RDP file (see Figure 1-8). Open the file (if it doesn’t automatically open) to connect to your VM.
-
Log in with the username and password credentials you specified during the configuration steps.

Figure 1-8. Connect via RDP.
Azure SDK 2.8 or Later
Besides installing Visual Studio, make sure that you have the Azure SDK version 2.8 or later. The following section walks you through the installation.
If you are using Visual Studio on your own machine:
-
Launch Visual Studio.
-
From the Tools menu, select Extensions and Updates.
-
In the tree on the left, select Updates and then Product Updates. You should see Microsoft Azure SDK 2.8.2 (or later) listed there. Click on the item in the listing and then click the Update button (see Figure 1-9).

Figure 1-9. Install Azure SDK 2.8.2.
-
Follow the prompts to download the update. Then run the downloaded file, stepping through the wizard until the installation is complete.
If you are using the VM with Visual Studio preinstalled, Azure SDK 2.8.2 or later should already be installed. If you find yourself in a situation where that is not the case, follow these steps:
-
Connect to the VM via Remote Desktop; the Server Manager application should launch automatically.
-
Click on the Local Server tab on the lefthand navigation bar.
-
In the Properties pane, click the On link next to IE Enhanced Security Configuration. If the link already reads Off you can skip the next step, which disables enhanced security for Internet Explorer.
-
Change Administrators to the Off setting and click OK.
-
Launch a browser and navigate to https://azure.microsoft.com/en-us/downloads.
-
Click the VS 2015 link under .NET, and when prompted click Run to install Azure SDK 2.8.2. Complete the installation wizard.
You should now be ready to attempt any of the examples used throughout this book.
Summary
This chapter provided a tour of the fundamentals of enterprise analytic architectures. We introduced the analytics data pipeline at a high level. We introduced the concepts behind a data lake, and then illustrated two canonical architectures that implement the data pipeline: lambda architecture and kappa architecture. We got a taste of all the Azure services we will cover (at varying levels of detail) in this book, expanding on our data analytics pipeline with the Azure services that are helpful to each phase. We then introduced Blue Yonder Airlines (BYA), a fictitious company from which we draw a case study that motivates our efforts and examples for the remainder of the book. We concluded the chapter with the prerequisites and setup instructions you will need to follow before attempting any of the book’s examples.
In the next chapter, we turn our attention to the first phase of the analytics data pipeline: ingest. There we will explore how we get our data into Azure in the first place.
Get Mastering Azure Analytics, 1st Edition now with the O’Reilly learning platform.
O’Reilly members experience books, live events, courses curated by job role, and more from O’Reilly and nearly 200 top publishers.

