Once the Grafana server is up-and-running, you can access it using a web browser to port 3000. For example http://127.0.0.1:3000 where it would navigate to login page. Upon authentication, we have to add a data source through the UI/CLI.
The following screenshot shows adding data sources through the web UI:
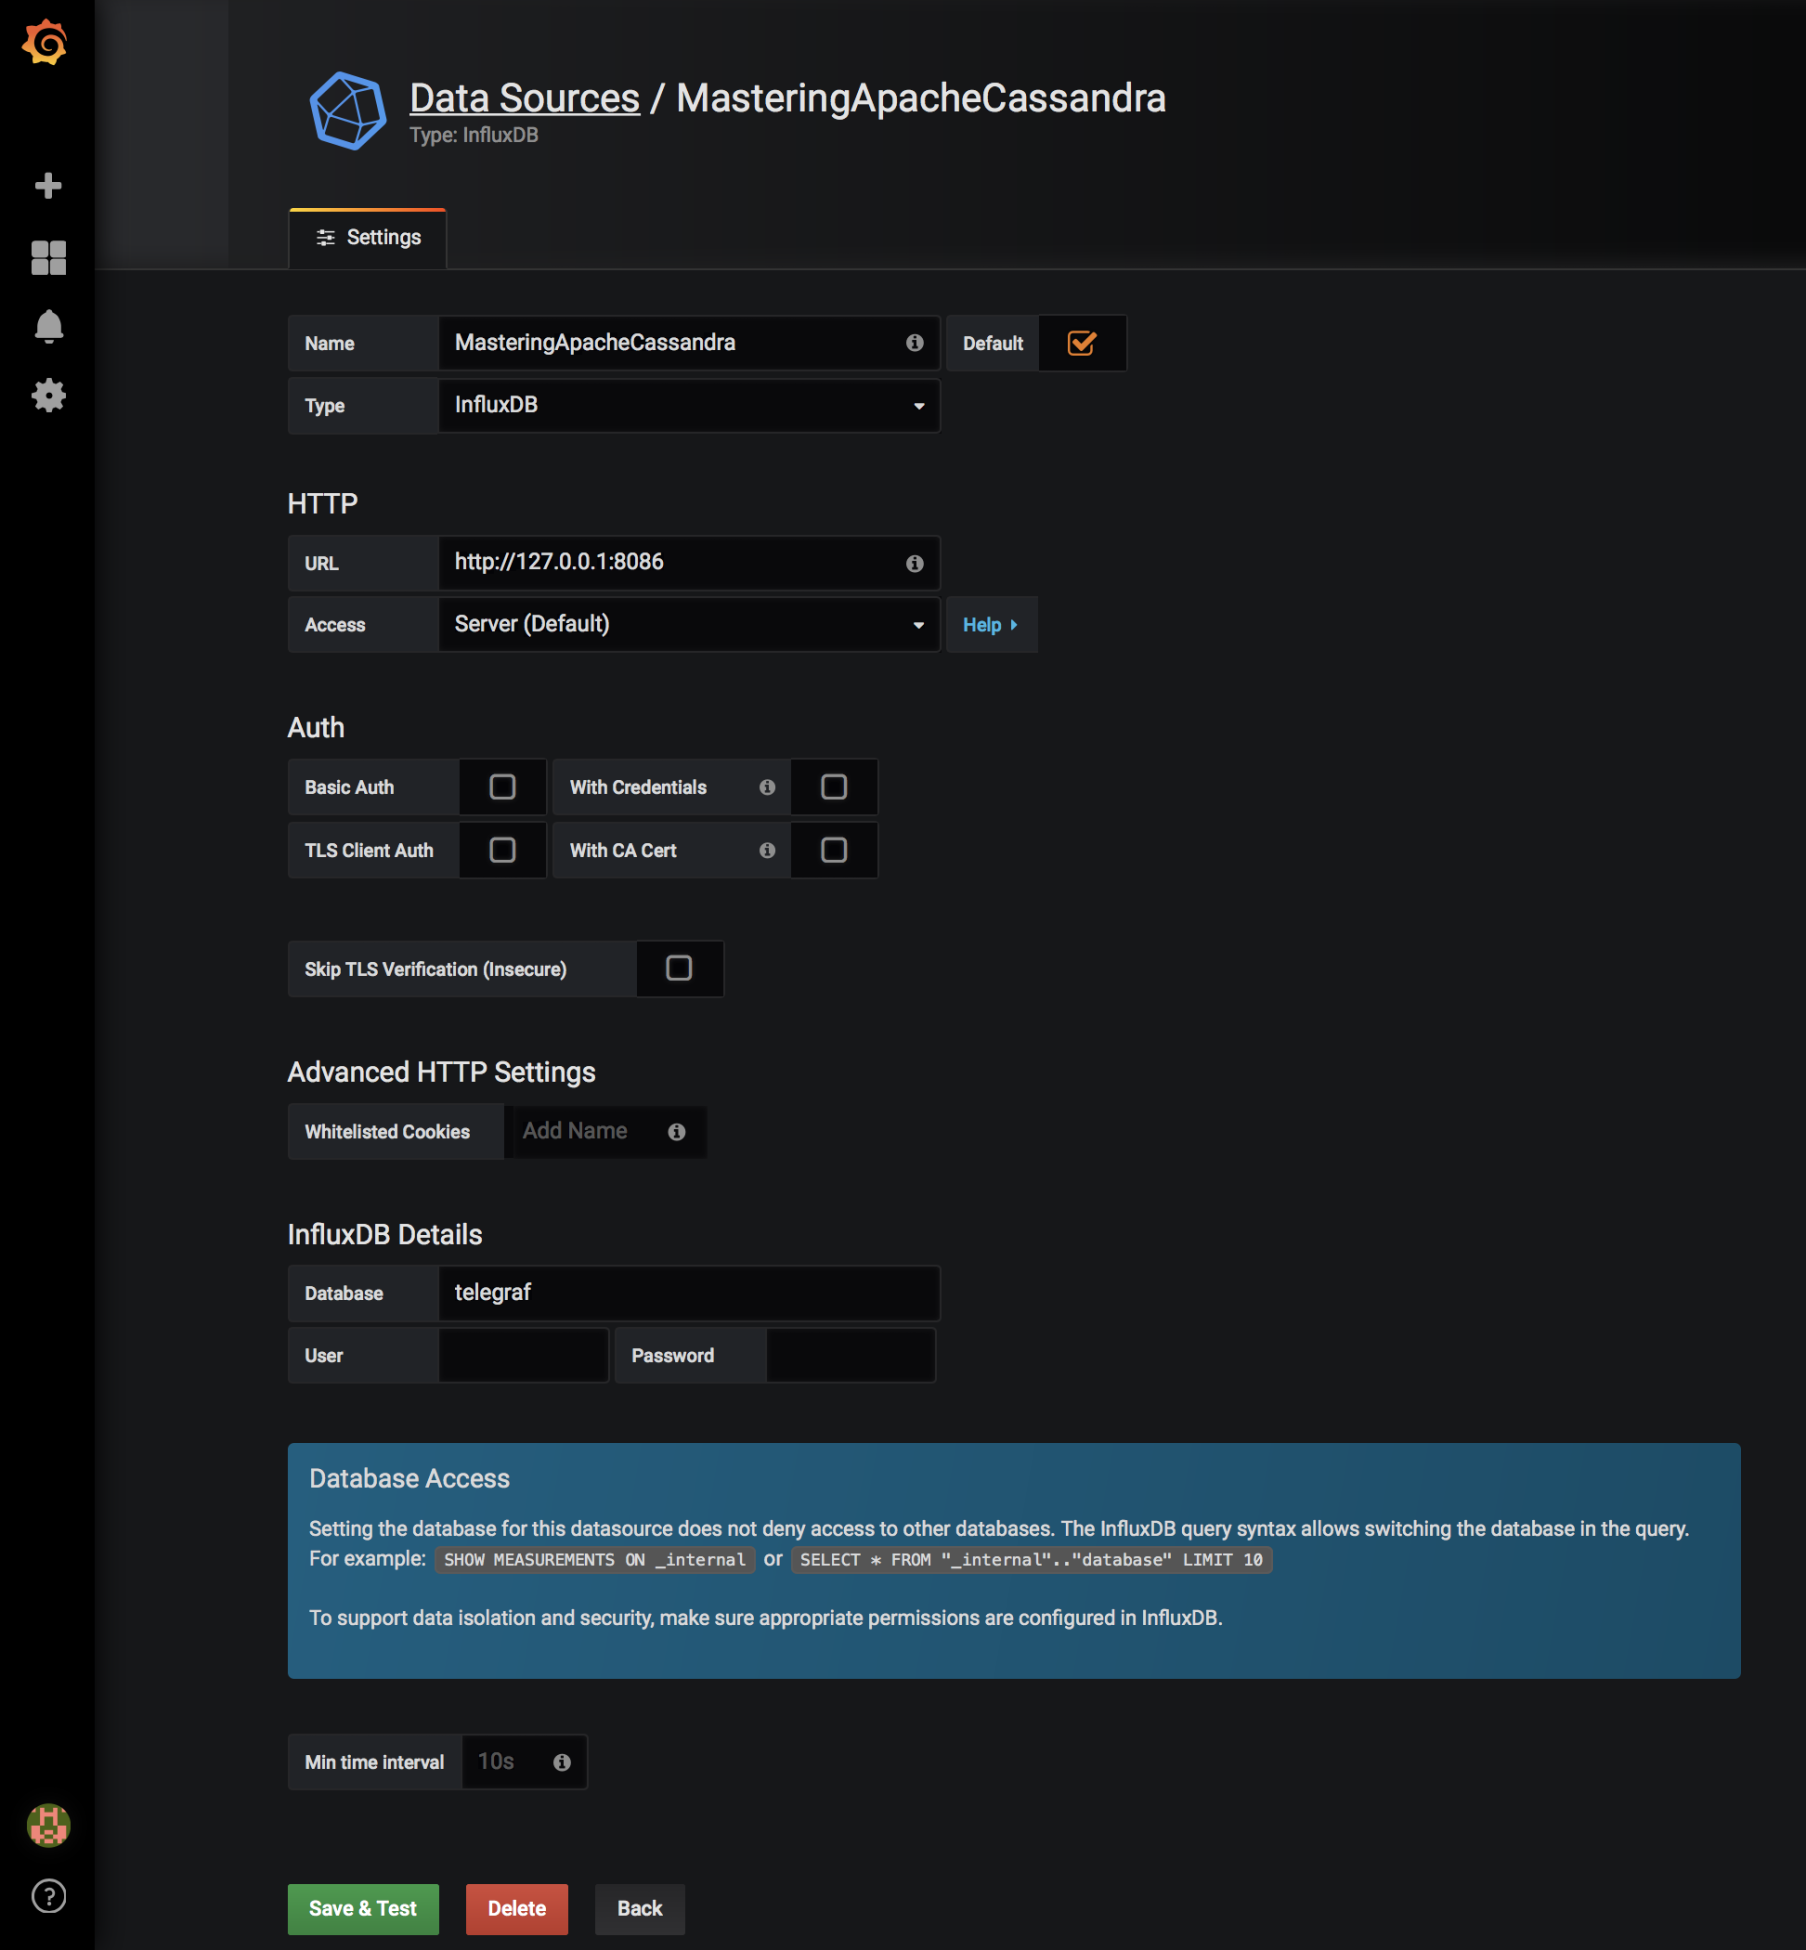
Figure 7.28: Adding data sources through the web UI
Through the CLI, we have to prepare a JSON file with all parameters. Then, we can post to the Grafana API, refer about docs for troubleshooting.
The following code shows adding a data source through the API:
cat > /tmp/grafanaDataSource.json <<EOF{ "id": 1, "orgId": 1, "name": ...
