Let's take a look at the line chart that we're going to create:
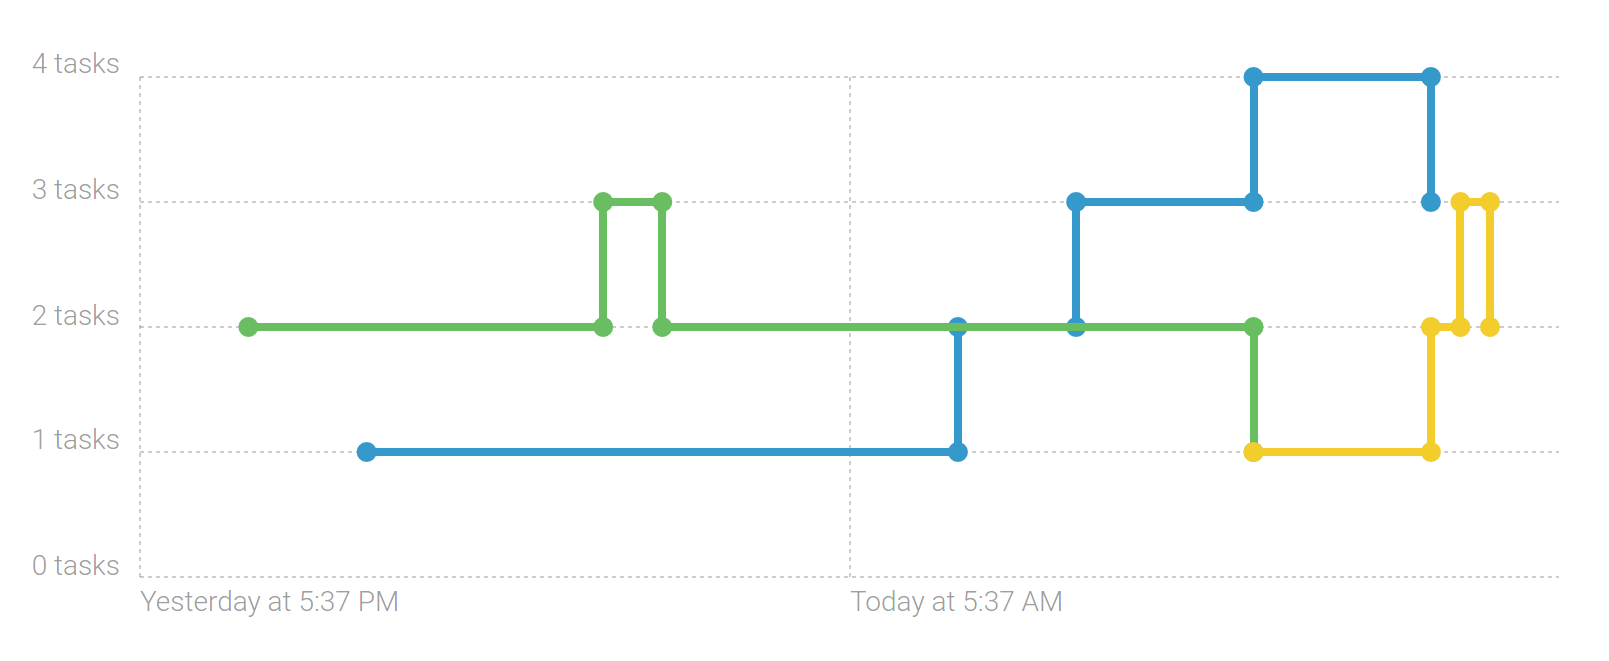
Open tasks visualized with our tasks chart component, using Chartist's step interpolation
We will utilize the refactored rasterize function of the previous topic, and will use the new accumulate mode to track open task counts over time.
Let's use the Angular CLI tool to create our new tasks chart component:
ng generate component --spec false -ve none -cd onpush projects-dashboard/tasks-chart
Let's edit the component class, on the path src/app/projects-dashboard/tasks-chart/tasks-chart.component.ts, and change its content to the following:
import { ...
