Measure the Product Backlog Burnup Chart
Sometimes the management team needs to see just how far along this project is; they might need to know not just the numbers of running, tested features but also which running, tested features are complete. That’s where you can generate a product backlog burnup chart, as in the Product Backlog Burnup Chart shown in the figure. Measure how much of each feature set (FS in the chart) the team completes on a periodic basis.
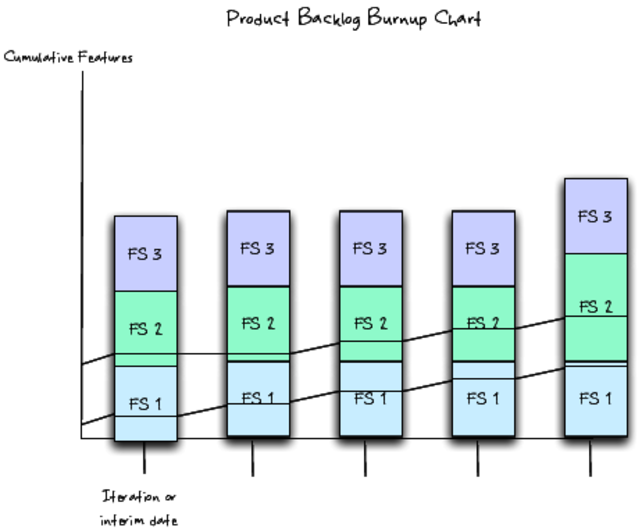
That’s a general product backlog burnup chart. The figure is an image of a team not quite finishing any feature set at the time of the last measurement.
You can see that the team is not ...
Get Manage Your Project Portfolio, 2nd Edition now with the O’Reilly learning platform.
O’Reilly members experience books, live events, courses curated by job role, and more from O’Reilly and nearly 200 top publishers.

