Measure the Product Backlog Burndown Chart
Sometimes the management team needs to see just how far along this project is; they might need to know not just knowing the numbers of running, tested features but also which running, tested features are complete. That’s where you can generate a product backlog burndown chart.
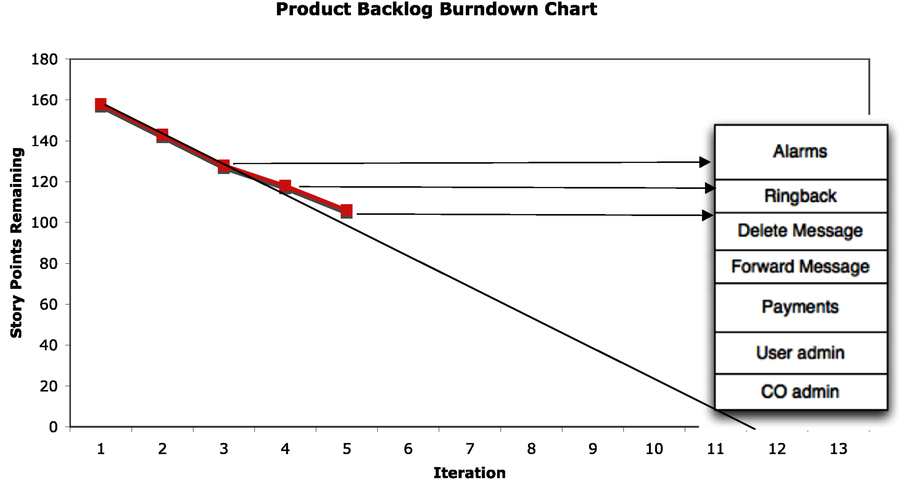
You can see that the team is not quite on their projected velocity, so it’s helpful to see what has been done and what’s left to do.
Get Manage Your Project Portfolio now with the O’Reilly learning platform.
O’Reilly members experience books, live events, courses curated by job role, and more from O’Reilly and nearly 200 top publishers.

