APPENDIX A ANSWERS TO EXERCISES
Chapter 2
| 1a. | Nominal |
| 1b. | Ratio |
| 1e. | Ratio |
| 1f. | Ratio |
| 1g. | Ratio |
| 1h. | Ratio |
| 1i. | Nominal |
| 2a. | 45 |
| 2b. | 45 |
| 2c. | 48.7 |
| 2d. | 53 |
| 2e. | 324.9 |
| 2f. | 18.02 |
| 3. | See Figure A.1 |
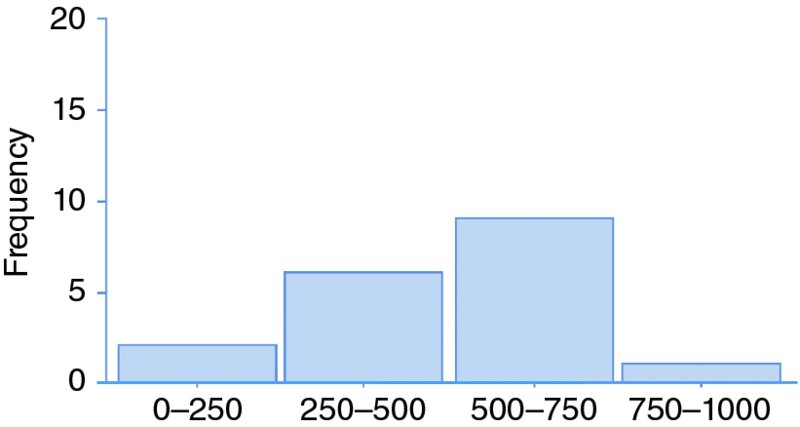
FIGURE A.1 Frequency distribution for Exercise 3 from Chapter 2.
Chapter 3
- See Table A.1
- See Table A.2
- See Table A.3
Chapter 4
See Table A.4
2a. See Table A.5
2b. See Table A.6
2c. See Table A.7
See Figure A.2
TABLE A.1 Chapter 3, Question 1 Answer
| Name | Weight (kg) | Weight (kg)—Normalize to 0–1 |
| P. Lee | 50 | 0.095 |
| R. Jones | 115 | 0.779 |
| J. Smith | 96 | 0.579 |
| A. Patel | 41 | 0 |
| M. Owen | 79 | 0.4 |
| S. Green | 109 | 0.716 |
| N. Cook | 73 | 0.337 |
| W. Hands | 104 | 0.663 |
| P. Rice | 64 | 0.242 |
| F. Marsh | 136 | 1 |
TABLE A.2 Chapter 3, Question 2 Answer
| Weight (kg)—Categorized | ||
| Name | Weight (kg) | (Low, Medium, High) |
| P. Lee | 50 | Low |
| R. Jones | 115 | High |
| J. Smith | 96 | Medium |
| A. Patel | 41 | Low |
| M. Owen | 79 | Medium |
| S. Green | 109 | High |
| N. Cook | 73 | Medium |
| W. Hands | 104 | High |
| P. Rice | 64 | Low |
| F. Marsh | 136 | High |
TABLE A.3 Chapter 3, Question 3 Answer
| Name | Weight (kg) | Height (m) | BMI |
| P. Lee | 50 | 1.52 | 21.6 |
| R. Jones | 115 | 1.77 | 36.7 |
| J. Smith | 96 | 1.83 | 28.7 |
| A. Patel | 41 | 1.55 | 17.1 |
| M. Owen | 79 | 1.82 | 23.8 |
| S. Green | 109 | 1.89 | 30.5 |
| N. Cook | 73 | 1.76 | 23.6 |
| W. Hands | 104 | 1.71 | 35.6 |
| P. Rice | 64 | 1.74 | 21.1 |
| F. Marsh | 136 | 1.78 | 42.9 |
TABLE A.4 Chapter 4, ...
Get Making Sense of Data I: A Practical Guide to Exploratory Data Analysis and Data Mining, 2nd Edition now with the O’Reilly learning platform.
O’Reilly members experience books, live events, courses curated by job role, and more from O’Reilly and nearly 200 top publishers.

