5.5 SUMMARY
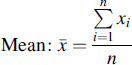
Central Tendency
Mode: Most common value
Median: Middle value
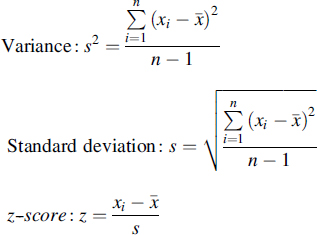
Variation
Range: high–low
Quartiles: Q1 (25%), Q2 (50%), Q3 (75%)
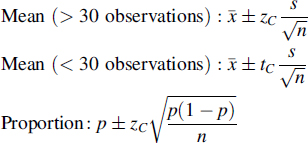
Confidence Levels
Hypothesis Test
Specify null (e.g. H0: μ = μ0) and alternative hypothesis (e.g. Ha: μ > μ0)
Select significance level (e.g. α = 0.05)
Compute test statistics (t- or z-)
Determine critical value for t or z using α/2 for two sided tests
Reject the null hypothesis if test statistic fall in the “reject H0” region
Comparing Groups
When comparing more than two groups, use:
Chi-square test for categorical data
One-way analysis of variance test for continuous.
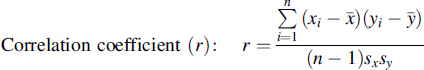
Comparing Variables
Get Making Sense of Data: A Practical Guide to Exploratory Data Analysis and Data Mining now with the O’Reilly learning platform.
O’Reilly members experience books, live events, courses curated by job role, and more from O’Reilly and nearly 200 top publishers.

